
The Cornerstone Association of REALTORS® (Cornerstone) has released its February 2026 real estate statistics, showing signs of greater stability across the Hamilton-Burlington-Haldimand-Niagara North market area. Home sales increased 7.4% month-over-month, while newly listed properties edged down 2.0% compared to January.
Inventory remained elevated in February, with the overall supply rising 2.2% year-over-year and reaching 3.5 months of supply across all property types by month-end. For buyers, that means more choice and more time to make decisions, while sellers continue to navigate a more competitive environment.
The MLS® Home Price Index (HPI) rose 1.6% month-over-month in February, marking its second straight monthly increase, although it remained 7.9% below February 2025 levels. This suggests the market may be starting to find more balance after the price adjustments seen over the past year.
As Bill Duce, CEO of Cornerstone, noted, “With inventory levels up and a modest month-over-month increase in sales, the Hamilton-Burlington market area is showing signs of stability.” He also pointed to the recent HPI gains as a sign the market may be moving toward a new equilibrium.
This Hamilton real estate market report for February 2026 will highlight:
- Regional trends in sales, new listings, inventory, and home prices
- What current supply levels reveal about market conditions
- What February’s market means for buyers and sellers
- A closer look at Hamilton and Burlington activity
Coming Up: Hamilton + Burlington Combined Market Snapshot – February 2026
Next, we’ll look at the combined Hamilton + Burlington market snapshot for February 2026, then move into a more focused breakdown of Hamilton market trends.
Hamilton + Burlington Combined Market Snapshot – February 2026
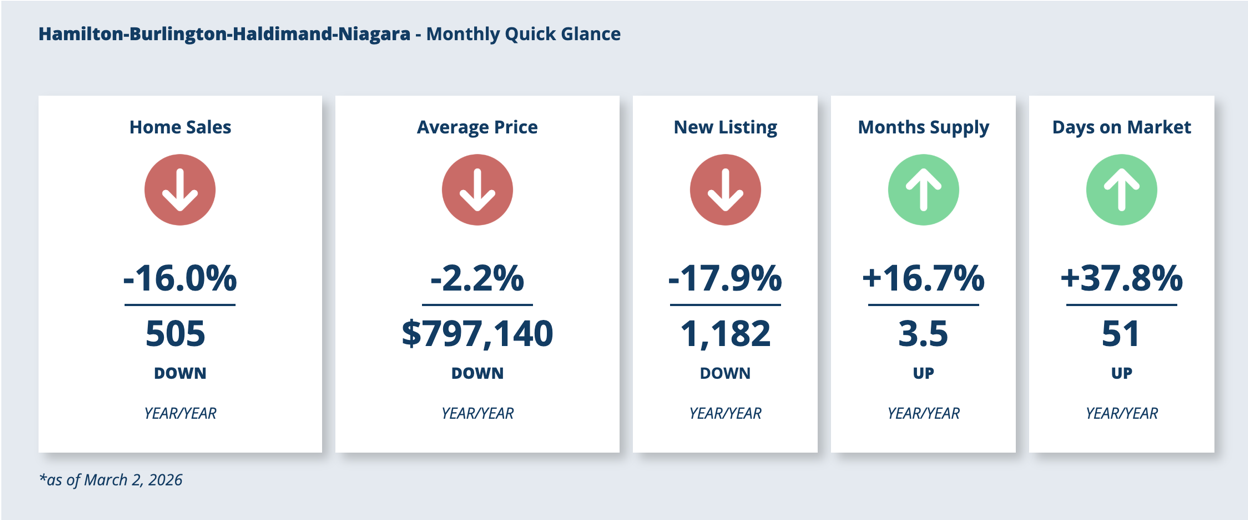
The Hamilton-Burlington-Haldimand-Niagara North market continued to show more balanced conditions in February, with buyers benefiting from increased choice and a slower pace than last year’s market. Across the region, 505 homes sold, down 16.0% year-over-year, while 1,182 new listings were added to the market, a 17.9% decline compared to February 2025.
The average price reached $797,140 in February, down a modest 2.2% year-over-year, while the months of supply rose to 3.5, up 16.7% from last year. Homes also took longer to sell, with average days on market climbing to 51 days, a 37.8% increase year-over-year. Altogether, these trends reflect a market that remains active, but with more time and flexibility for buyers and more competition for sellers.
Hamilton-Burlington-Haldimand-Niagara North Area Highlights
- Sales: 505 (↓ 16.0% year-over-year)
- New listings: 1,182 (↓ 17.9% year-over-year)
- Average price: $797,140 (↓ 2.2% year-over-year)
- Months of supply: 3.5 (↑ 16.7% year-over-year)
- Average days on market: 51 days (↑ 37.8% year-over-year)
Average Price Snapshot by Area
- Hamilton: $718,545 (↓ 6.1% year-over-year)
- Burlington: $1,066,177 (↑ 1.7% year-over-year)
- Haldimand County: $599,276 (↓ 13.8% year-over-year)
- Niagara North: $803,387 (↑ 5.7% year-over-year)
What this suggests right now: February’s regional numbers point to a market that’s becoming more measured and more balanced. Buyers have more room to compare options and move thoughtfully, while sellers can still achieve strong results when pricing, presentation, and strategy are aligned with current market conditions.
Coming Up: Hamilton Residential Real Estate Market – February 2026
Next, we’ll move into a closer look at the Hamilton residential real estate market, including sales, new listings, inventory, pricing trends, and what February’s results reveal at the local level.
Hamilton Residential Real Estate Market – February 2026
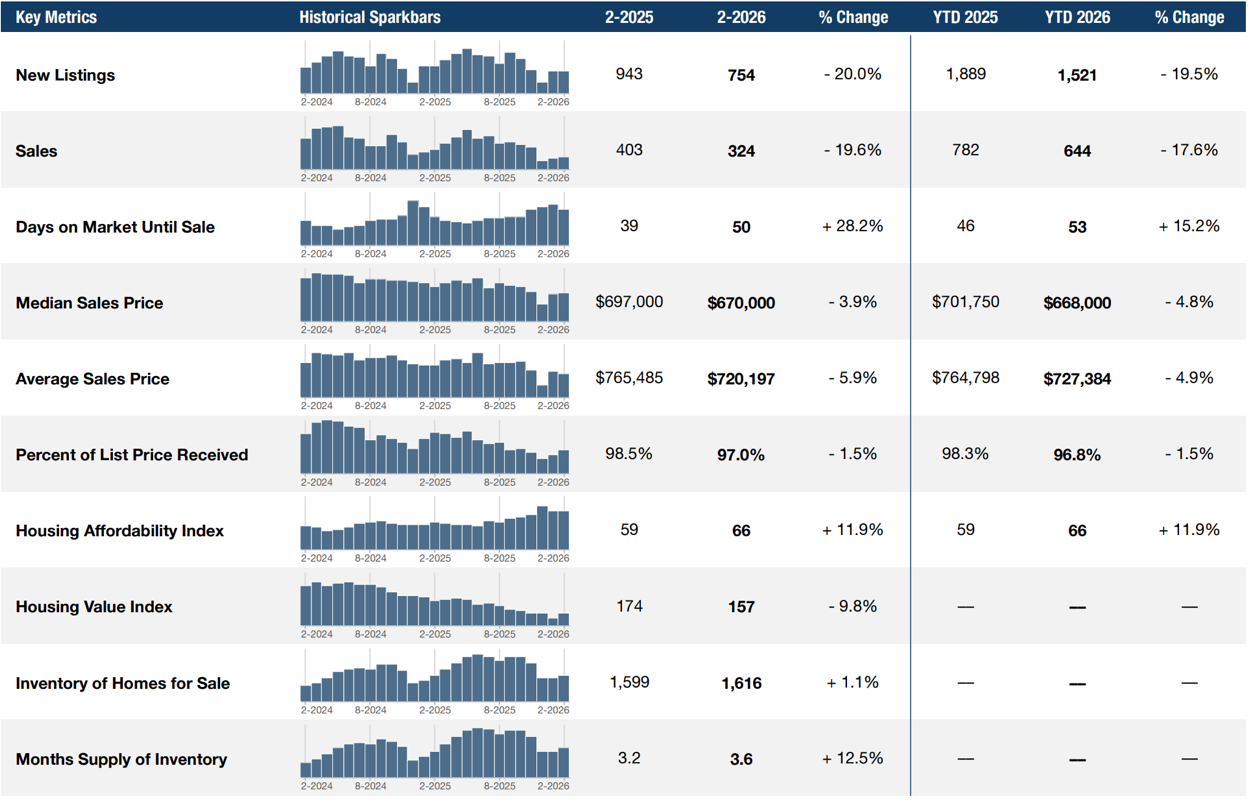
Hamilton’s residential real estate market continued at a more measured pace in February, with both sales and new listing activity remaining below last year’s levels. According to Cornerstone’s residential data, 324 homes sold in Hamilton, down 19.6% year-over-year, while 754 new listings were added to the market, a 20.0% decline compared to February 2025.
Market conditions also continued to shift toward a more balanced environment. Days on market until sale rose to 50 days, up 28.2% year-over-year, while active inventory reached 1,616 homes, a modest 1.1% increase over last year. This pushed months of supply to 3.6, up 12.5% year-over-year, giving buyers more time and more flexibility than in tighter market conditions.
Pricing remained softer year-over-year in February. The median sales price came in at $670,000, down 3.9%, while the average sales price was $720,197, down 5.9%. Sellers also received a slightly smaller share of the asking price on average, with the percent of list price received at 97.0%, compared to 98.5% last year.
Hamilton Residential Market Snapshot
- Sales: 324 (↓ 19.6% year-over-year)
- New listings: 754 (↓ 20.0% year-over-year)
- Days on market until sale: 50 (↑ 28.2% year-over-year)
- Median sales price: $670,000 (↓ 3.9% year-over-year)
- Average sales price: $720,197 (↓ 5.9% year-over-year)
- Percent of list price received: 97.0% (down from 98.5% or ↓ 1.5%)
- Inventory of homes for sale: 1,616 (↑ 1.1% year-over-year)
- Months of supply: 3.6 (↑ 12.5% year-over-year)
What this suggests right now: Hamilton’s residential market remains more balanced than it was a year ago. Buyers are benefiting from more time and a little more negotiating room, while sellers can still achieve solid results with accurate pricing and strong presentation.
Coming Up: Hamilton Market Breakdown by Housing Segment
Next, we’ll break down Hamilton’s February 2026 market performance by Single Family homes and Townhouse/Condo properties to see how sales, inventory, pricing, and time on market differed between these two housing segments.
Hamilton Market Breakdown by Housing Segment
Hamilton’s February 2026 housing market showed softer activity across both major residential segments, with Single Family homes and Townhouse/Condo properties both seeing fewer new listings and fewer sales compared to last year.
The broader Canadian market also slowed in February, with the Canadian Real Estate Association (CREA) reporting a 5.8% month-over-month decline in home sales and a 16.2% year-over-year decrease on a non-seasonally adjusted basis, due in part to weather-related disruptions and weaker activity across Southwestern Ontario and the Greater Golden Horseshoe.
At the local level, Hamilton’s Single Family segment saw a sharper slowdown in sales activity, while the Townhouse/Condo segment experienced a larger increase in supply. Both segments also recorded lower prices and longer selling times year-over-year, reinforcing the shift toward more balanced conditions across the market.
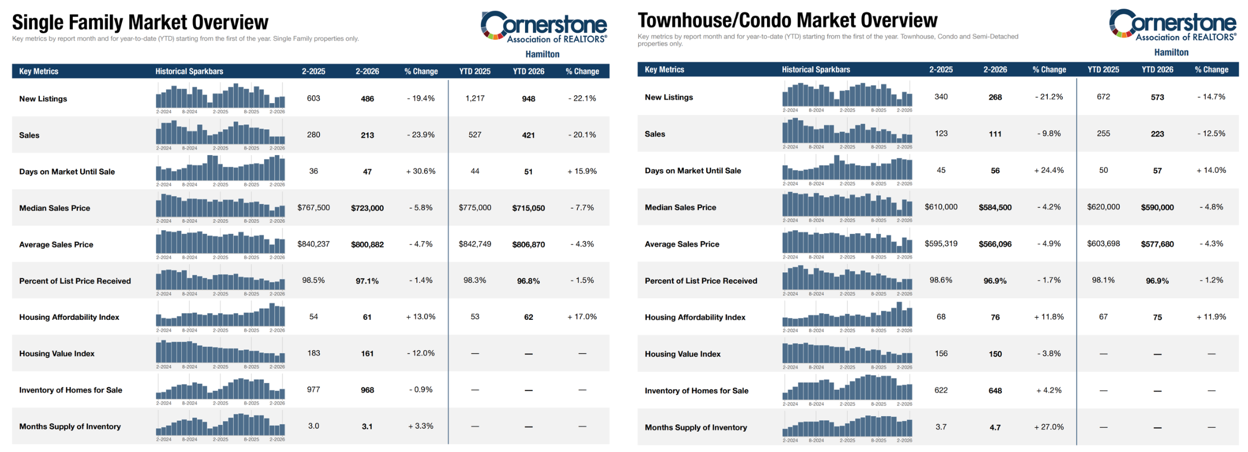
Single Family Market Snapshot
- New listings: 486 (↓ 19.4% year-over-year)
- Sales: 213 (↓ 23.9% year-over-year)
- Days on market until sale: 47 (↑ 30.6% year-over-year)
- Median sales price: $723,000 (↓ 5.8% year-over-year)
- Average sales price: $800,882 (↓ 4.7% year-over-year)
- Percent of list price received: 97.1% (down from 98.5% or ↓ 1.4%)
- Inventory of homes for sale: 968 (↓ 0.9% year-over-year)
- Months of supply: 3.1 (↑ 3.3% year-over-year)
Single Family homes remained the higher-priced segment in Hamilton, but February’s numbers point to a slower pace than last year. Sales fell more than new listings, homes took longer to sell, and prices softened, suggesting that buyers in this segment are continuing to gain more time and negotiating room.
Townhouse/Condo Market Snapshot
- New listings: 268 (↓ 21.2% year-over-year)
- Sales: 111 (↓ 9.8% year-over-year)
- Days on market until sale: 56 (↑ 24.4% year-over-year)
- Median sales price: $584,500 (↓ 4.2% year-over-year)
- Average sales price: $566,096 (↓ 4.9% year-over-year)
- Percent of list price received: 96.9% (down from 98.6% or ↓ 1.7%)
- Inventory of homes for sale: 648 (↑ 4.2% year-over-year)
- Months of supply: 4.7 (↑ 27.0% year-over-year)
The Townhouse/Condo segment also saw softer pricing and slower movement in February, but the most notable shift was in supply. With inventory and months of supply rising more sharply than in the Single Family segment, buyers in this category are likely seeing more options and less pressure than they did a year ago.
What this suggests right now: February’s segment-level results show that both property types are adjusting to a more balanced market, though the shift is more pronounced in the Townhouse/Condo segment. Buyers across both categories have more time and flexibility, while sellers are likely to see the best results when pricing and presentation reflect current market conditions.
Coming Up: Hamilton District Snapshot: Prices & Sales by Area
Next, we’ll look at how sales and prices performed across Hamilton’s featured districts to highlight where market activity remained steadier and where conditions softened more noticeably in February.
Hamilton District Snapshot: Prices & Sales by Area
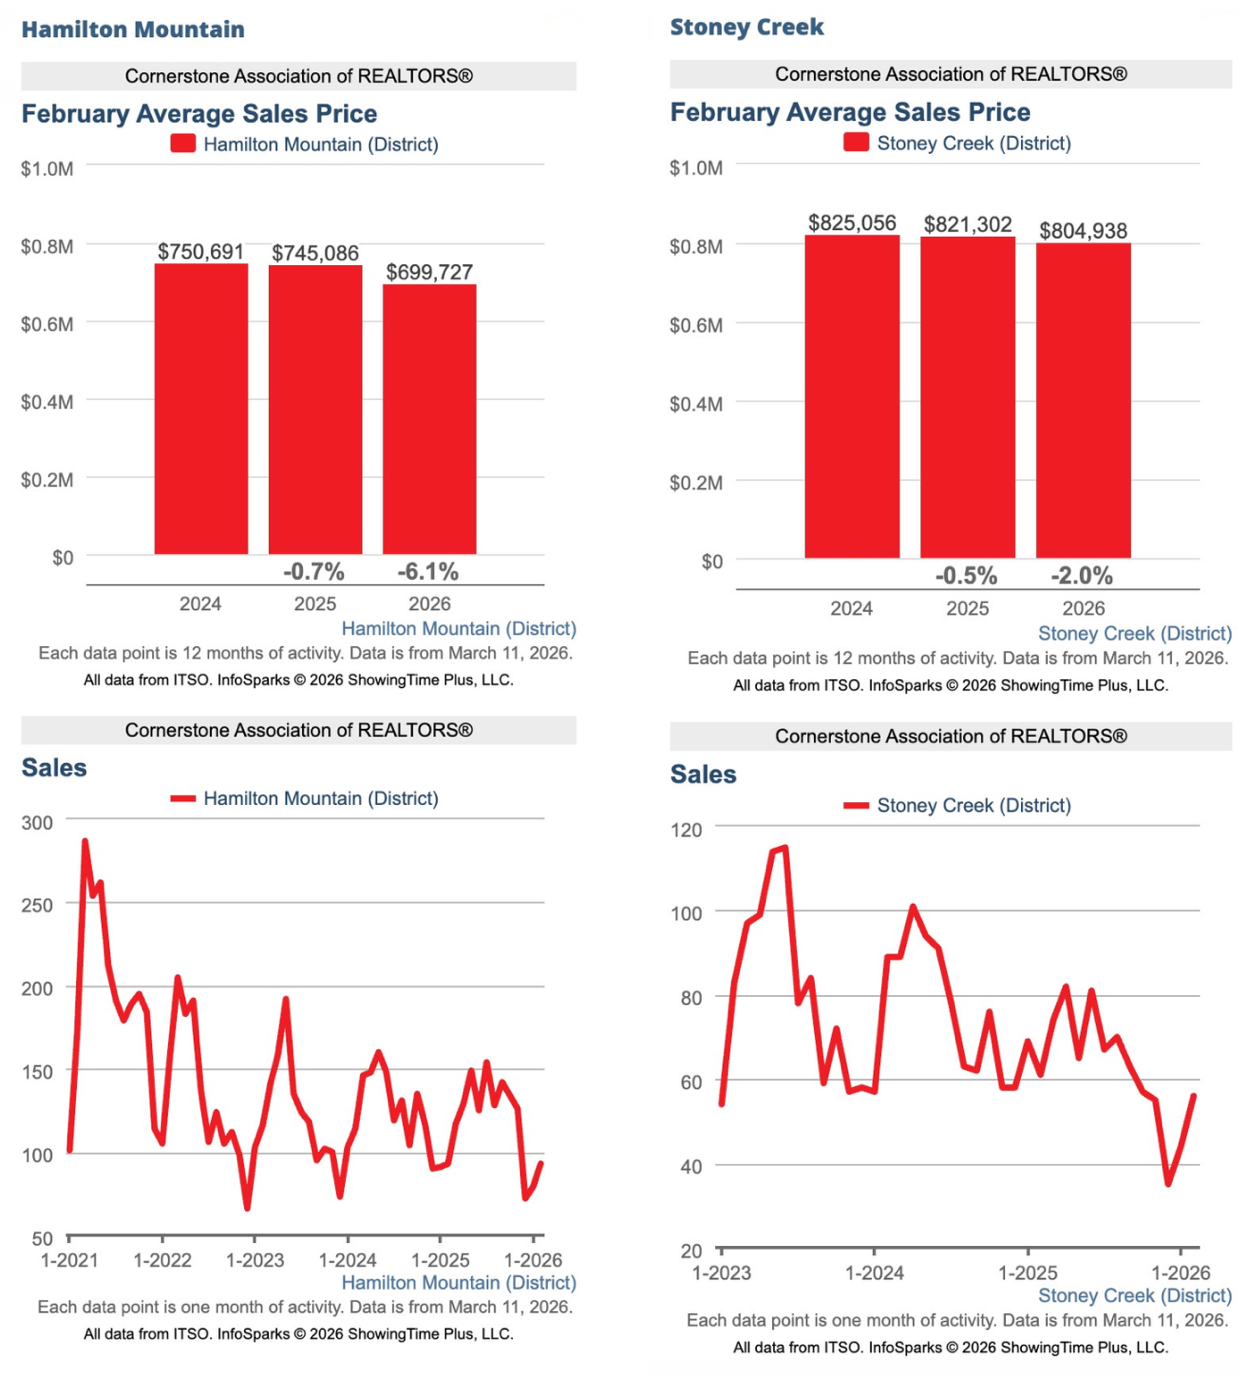
While city-wide trends provide the broader picture, district-level performance helps highlight where momentum was strongest in February. Sales activity was strongest in Hamilton Mountain and Stoney Creek, making these two districts the featured areas in this month’s report.
February 2026 District Highlights
- Hamilton Mountain: 93 sales, with an average sale price of $699,727 (↓ 6.1% year-over-year)
- Stoney Creek: 56 sales, with an average sale price of $804,938 (↓ 2.0% year-over-year)
Hamilton Mountain led all districts in sales activity in February with 93 sales, while Stoney Creek followed with 56 sales. Both districts saw solid market activity during the month, even as average prices adjusted modestly year-over-year within a more balanced Hamilton market.
What this suggests right now: Even within a softer overall market, demand continues to hold in established Hamilton areas. For buyers and sellers alike, neighbourhood-level trends remain an important part of understanding pricing, timing, and local market momentum.
Coming Up: Market Summary & What It Means for You
Next, we’ll bring February’s numbers together into key takeaways for buyers and sellers, and what they may mean if you’re planning a move in Hamilton in 2026.
Summary & Expert Insights: Hamilton Real Estate Market – February 2026
February brought more balanced conditions across the Hamilton-Burlington-Haldimand-Niagara North market area, with inventory remaining elevated and sales showing a modest month-over-month gain. The MLS® Home Price Index (HPI) also rose for the second straight month, suggesting the market may be moving toward greater stability after last year’s price adjustments.
Within the combined Hamilton-Burlington market snapshot, 505 homes sold in February, down 16.0% year-over-year, while 1,182 new listings were added, down 17.9%. The average price reached $797,140 (↓ 2.2% year-over-year), and days on market rose to 51 days, reflecting a slower, more measured pace.
Hamilton’s residential market followed a similar pattern. The city recorded 324 sales (↓ 19.6% year-over-year) and 754 new listings (↓ 20.0%), while months of supply rose to 3.6 and days on market until sale increased to 50 days. The average sales price came in at $720,197, while the median sales price was $670,000.
By housing segment, both Single Family homes and Townhouse/Condo properties saw lower sales, softer prices, and longer selling times than a year ago. Supply conditions remained more buyer-friendly in the Townhouse/Condo segment, while Hamilton Mountain and Stoney Creek led the city in sales activity at the district level.
As Bill Duce, CEO of Cornerstone, noted, “With more inventory to choose from and longer days on market, buyers are benefiting from more time and options.” That remained one of February’s clearest themes across both the broader regional market and Hamilton itself.
What This Means for You
- Buyers: More inventory and longer selling timelines mean more opportunity to compare options and negotiate with confidence.
- Sellers: Homes are still selling, but strategy matters more in a market where buyers have greater choice.
- Investors: More balanced conditions may create opportunities in segments where supply is rising and pricing has softened.
Up Next: Turning Market Insight Into Your Next Step
Whether you are planning to buy, sell, or simply stay informed, understanding the latest market trends is only part of the equation. Having trusted local guidance can help you put the data into context and move forward with greater confidence in the Hamilton real estate market.
Ready to Navigate the Hamilton Real Estate Market? Work With Judy Marsales Real Estate Brokerage
Whether you are buying, selling, or exploring your next move, working with a knowledgeable local real estate sales representative can make all the difference. Judy Marsales Real Estate Brokerage brings decades of experience, neighbourhood-level insight, and personalized service to clients across Hamilton, Dundas, Ancaster, Burlington, and surrounding areas.
Why Work With Judy Marsales Real Estate Brokerage
- Local market expertise backed by in-depth knowledge of Hamilton-area neighbourhoods and pricing trends
- Personalized real estate guidance for buyers, sellers, downsizers, and investors
- Current market insight to help you make confident, informed decisions in a changing market
Stay Connected
Follow Judy Marsales Real Estate Brokerage on Facebook and Instagram for local real estate market updates, new listings, open houses, and community news.
Get in Touch
Curious about your home’s current value in today’s Hamilton real estate market? Use the Home Value Calculator for a quick estimate, or reach out for a more detailed neighbourhood-specific evaluation. And for a broader context, you can also review Cornerstone’s February 2026 market statistics.
When you’re ready to buy or sell in the Hamilton real estate market, trust Judy Marsales Real Estate Brokerage for local expertise, personalized service, and results-driven strategy.