Hamilton Real Estate Market Update – September 2025
The Cornerstone Association of REALTORS® (Cornerstone) has released its September 2025 real estate market statistics, showing a continued lift in year-over-year sales activity. A total of 773 homes were sold across the Hamilton, Burlington, Haldimand County, and Niagara North market area last month. This marked the third straight month of improved performance compared to 2024. Despite this encouraging trend, overall sales remain 27 per cent below long-term seasonal averages and nearly 10 per cent lower year-to-date, pointing to a market that’s gradually recovering but not yet back to typical levels.
This Hamilton real estate market update for September 2025 will highlight:
- Key takeaways for buyers, sellers, and investors navigating shifting market conditions.
- Sales, new listings, and pricing trends across Hamilton and surrounding communities.
- Regional insights and neighbourhood-level dynamics shaping local activity.
Sales activity may be improving, but it’s still well below historical norms, reflecting a market in transition. Rising new listings and higher inventory are giving buyers more choice, but they’re also adding pressure on prices. Benchmark values across the region have fallen more than nine per cent year-over-year, though some neighbourhoods continue to outperform the broader average.
“More inventory is creating opportunities for buyers, even as prices adjust,” notes Nicolas von Bredow, Cornerstone spokesperson for the Hamilton-Burlington market area.
New listings climbed sharply in September, with 2,188 properties added to the MLS® System. This increase brought the sales-to-new listings ratio down to 35 per cent, pushing inventory higher and raising months of supply to five — a level that points to more balanced conditions and increased options for buyers.
The unadjusted benchmark price was $753,300, holding steady compared to August but sitting more than nine per cent below levels from a year ago. Elevated supply and shifting buyer dynamics continue to shape a competitive but more flexible fall housing market.
Coming Up: A Closer Look at Hamilton’s Housing Market
Next, we’ll turn our attention to Hamilton’s residential activity, including sales trends, pricing, and district-level breakdowns that reveal how different parts of the city are performing.
Hamilton Residential Real Estate – Price, Sales & Market Conditions
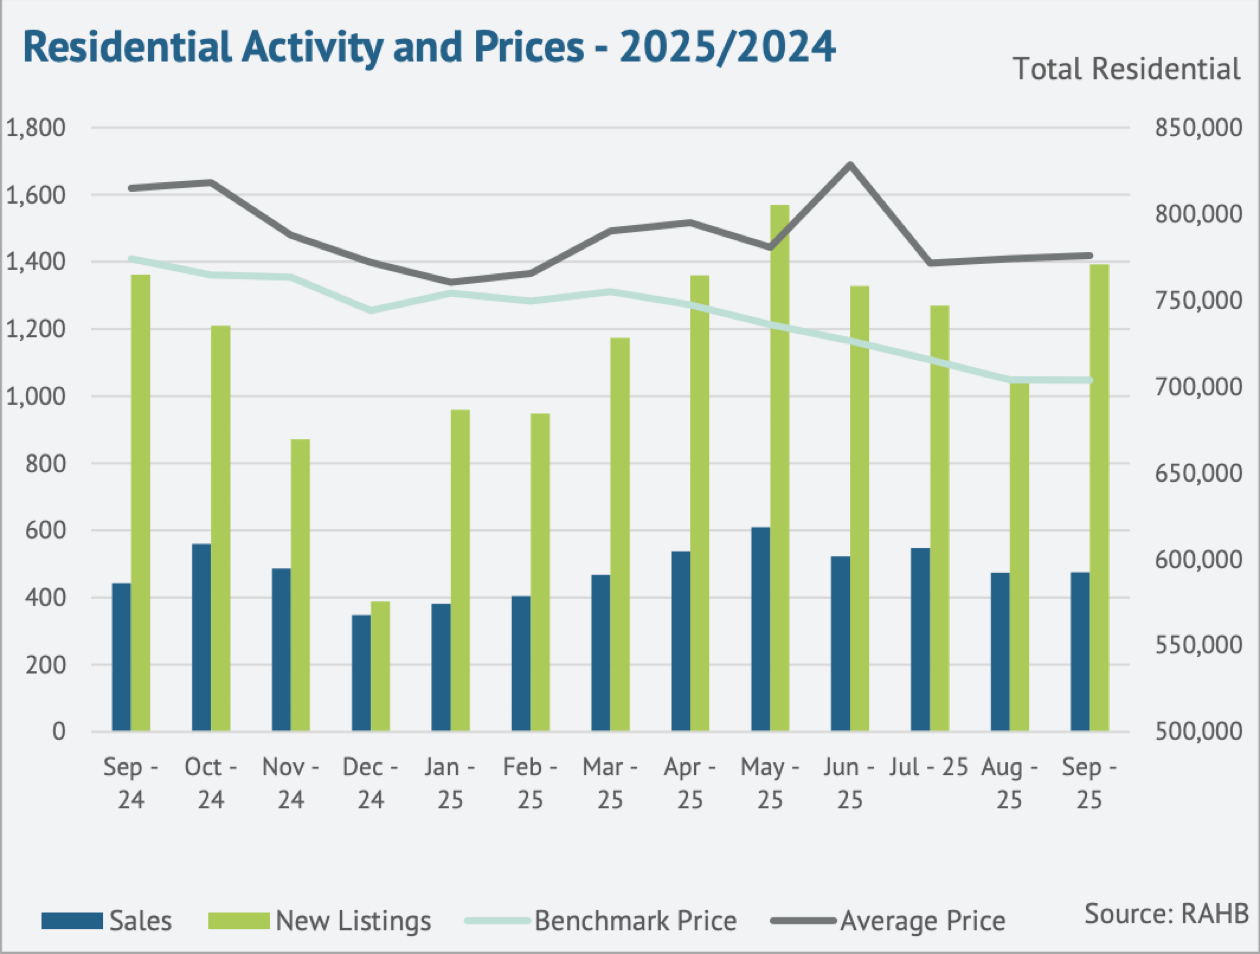
Hamilton’s residential real estate market saw a measured lift in September, with 475 sales recorded across the city. While activity improved slightly from the previous month, overall levels remain more than 26 per cent below long-term seasonal averages, pointing to a market that’s stabilizing but still adjusting to elevated supply and shifting buyer behaviour.
The strongest gains came from detached and semi-detached homes, which helped support the increase in overall sales. Even so, higher inventory levels and ongoing affordability challenges continue to shape a slower-paced, more balanced market environment.
Inventory and Listing Activity
New listings rose to 1,392 in September, a modest year-over-year increase, while overall inventory levels climbed to 2,487 active listings, up 13.7 per cent from last year. This steady growth in available supply has pushed the sales-to-new listings ratio down to around 35 per cent, creating more choice for buyers and applying gentle downward pressure on pricing.
The months of supply increased to 5.2, highlighting the broader inventory build-up across the market. Oversupply was most evident in the row and apartment sectors, while Dundas reported the tightest conditions with four months of supply. By contrast, Hamilton West recorded nearly nine months, underscoring the wide variation between neighbourhoods and how inventory levels can shape local market dynamics.
Pricing Trends and Buyer Conditions
The benchmark price in Hamilton was $703,700, holding steady compared to August but down 9 per cent year-over-year. The average residential sale price reached $775,745, a 4.8 per cent decline from September 2024. These figures reflect a market where rising inventory continues to influence pricing, particularly in sectors with higher supply.
Among property types, apartment condos saw the sharpest price adjustment, with values down more than 11 per cent year-over-year. Semi-detached homes experienced the smallest decline, at just under six per cent. The average days on market rose to 40 days, up from last year, indicating properties are taking longer to sell — a clear sign of shifting dynamics that continue to favour buyers.
Looking Ahead: Property Type Breakdown
This wraps up the overview of Hamilton’s residential market performance for September 2025. In the next section, we’ll break down activity by property type, including detached, semi-detached, townhomes, and apartment-style properties, to provide a clearer picture of where opportunities may be emerging for buyers and sellers this fall.
Breakdown by Property Type – Hamilton September 2025
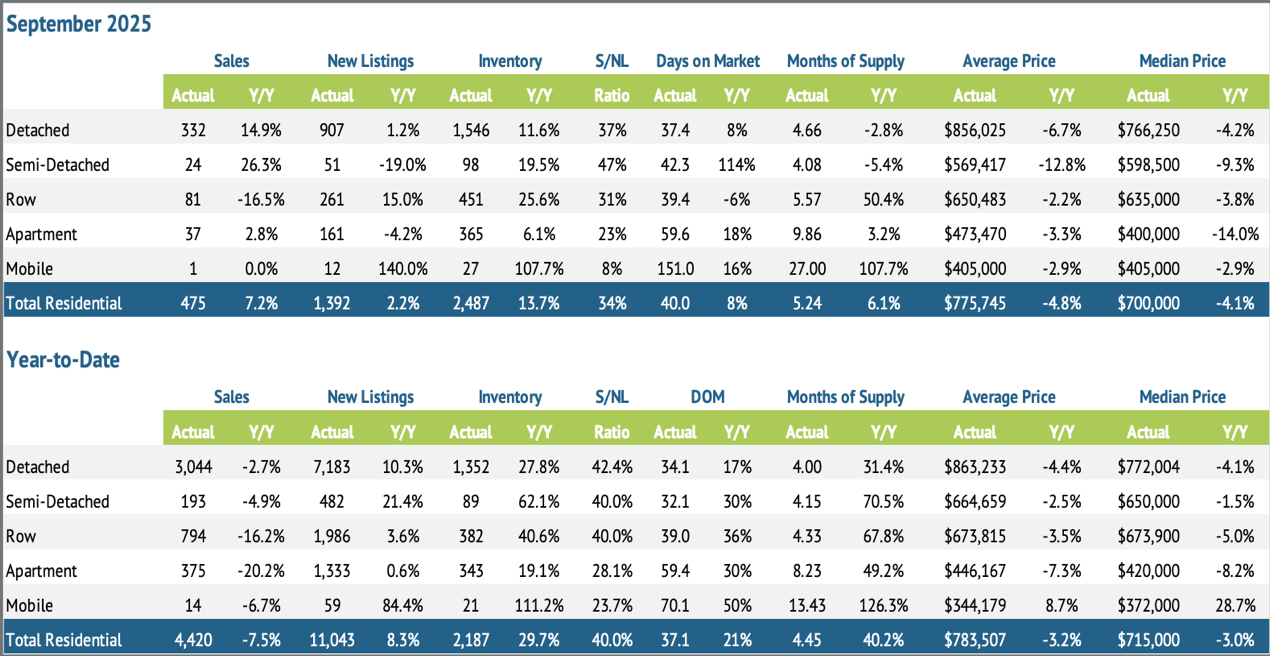
September continued to show distinct trends across property types. Detached homes led overall activity, while row and apartment segments felt the weight of higher supply. Semi-detached sales improved year over year, though pricing remained under pressure. Overall, elevated inventory continues to shape pricing and days on market.
Detached Homes
- Sales: 332 (↑ 14.9% YoY)
- New Listings: 907 (↑ 1.2%)
- Inventory: 1,546 (↑ 11.6%)
- Average Price: $856,025 (↓ 6.7%)
- Benchmark Price: $769,100 (↓ 8%)
Semi-Detached Homes
- Sales: 24 (↑ 26.3% YoY)
- New Listings: 51 (↓ 19.5%)
- Inventory: 98 (↑ 19.5%)
- Average Price: $569,417 (↓ 12.8%)
- Benchmark Price: $698,400 (↓ 6%)
Sales improved in this segment even as pricing adjusted. Lower new-listing volumes alongside rising inventory point to slower absorption and careful buyer positioning.
Row (Townhomes)
- Sales: 81 (↓ 16.5% YoY)
- New Listings: 261 (↑ 15.0%)
- Inventory: 451 (↑ 25.6%)
- Average Price: $650,483 (↓ 2.2%)
- Benchmark Price: $610,800 (↓ 7%)
Supply growth outpaced demand, keeping conditions competitive for sellers and encouraging strategic pricing.
Apartments & Condos
- Sales: 37 (↑ 2.8% YoY)
- New Listings: 161 (↓ 4.2%)
- Inventory: 365 (↑ 6.1%)
- Average Price: $473,470 (↓ 3.3%)
- Benchmark Price: $409,800 (↓ 11%)
This segment posted the largest year-over-year benchmark decline, reflecting ongoing affordability recalibration and higher relative supply.
Coming Up: Regional Summary
Next, we’ll shift to regional activity across Hamilton’s most active areas, with a spotlight on Hamilton Mountain and Stoney Creek. This view helps clarify where buyer demand and available inventory are most concentrated heading into the fall.
Regional Summary – September 2025
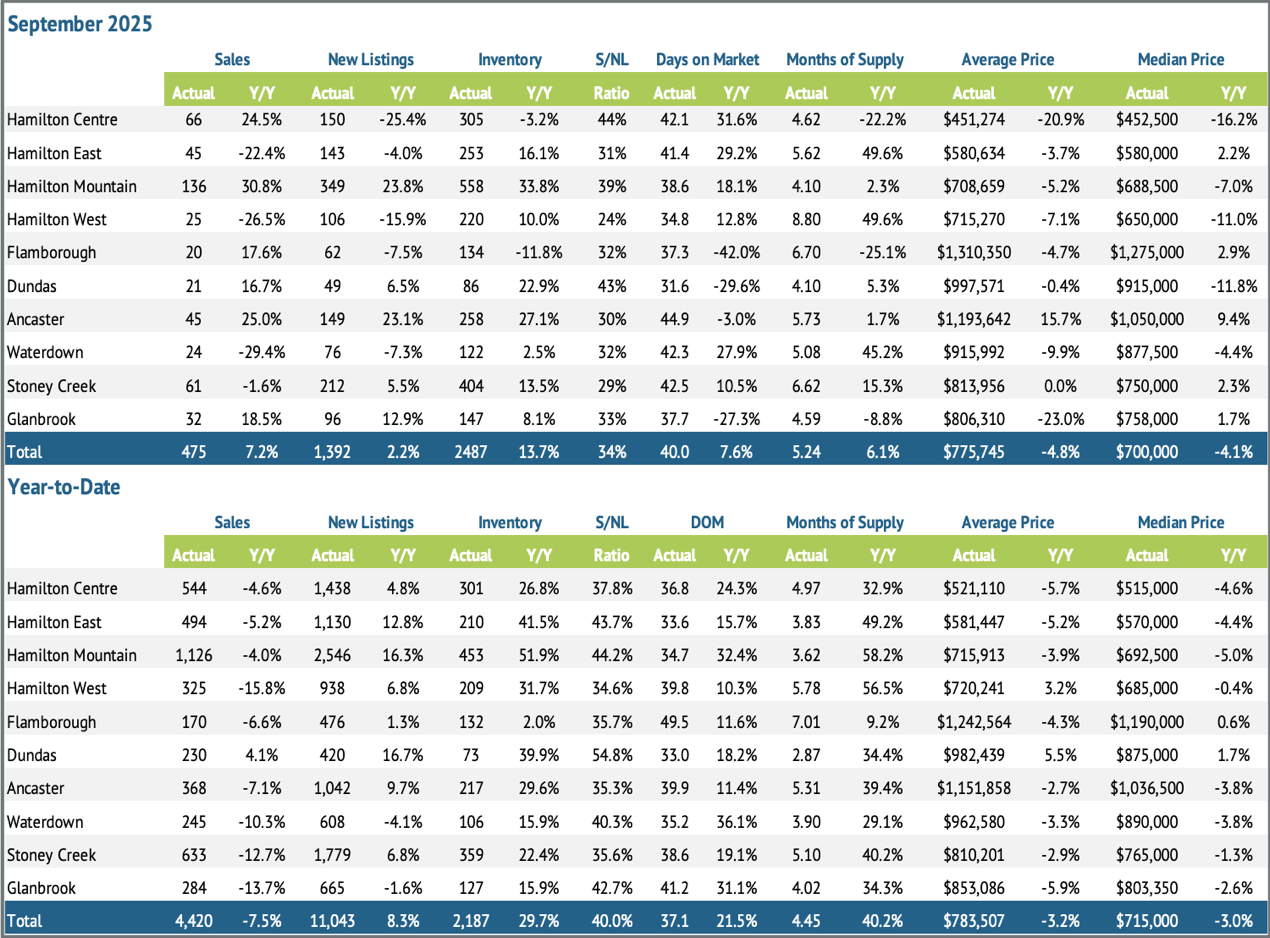
Hamilton’s housing market held steady in September. Hamilton Mountain led with the highest sales and inventory, Stoney Creek showed stable activity with more supply, and Ancaster stood out with strong year-over-year growth.
Hamilton Mountain remained the city’s most active area, while rising inventory in Stoney Creek gave buyers more leverage. Ancaster saw a 25% jump in sales and posted the highest average price city-wide, highlighting steady demand in the upper end of the market.
Overall, elevated inventory continues to support more balanced conditions heading into fall.
Key Metrics by Area – September 2025
Hamilton Mountain
- Sales: 136 (↑ 30.8%)
- New Listings: 349 (↑ 23.8%)
- Inventory: 558 (↑ 33.8%)
- Months of Supply: 4.10 (↑ 2.3%)
- Average Price: $708,659 (↓ 5.2%)
Stoney Creek
- Sales: 61 (↓ 1.6%)
- New Listings: 212 (↑ 5.5%)
- Inventory: 404 (↑ 13.5%)
- Months of Supply: 6.62 (↑ 15.3%)
- Average Price: $813,950 (↓ 10.5%)
Ancaster
- Sales: 45 (↑ 25.0%)
- New Listings: 149 (↑ 23.1%)
- Inventory: 258 (↑ 27.1%)
- Months of Supply: 5.73 (↑ 1.7%)
- Average Price: $1,193,642 (↑ 15.7%)
Across Hamilton’s key regions, elevated supply and pricing adjustments are shaping local market activity, while Ancaster’s growth signals renewed strength in the city’s higher-end segment. Hamilton Mountain remains the core driver of overall activity, with Stoney Creek and Ancaster illustrating diverse market dynamics heading into the fall season.
Coming Up: Average Residential Prices by District
With regional sales and supply trends in focus, we’ll now take a closer look at average residential sale prices by district, including Hamilton Mountain, Stoney Creek, and Ancaster. This will provide deeper insight into how neighbourhood-level pricing is responding to shifting market conditions.
Average Residential Prices by District – September 2025
Average sale prices across Hamilton’s neighbourhoods continued to show clear differences between districts, reflecting a market where some areas are softening while others are strengthening. For September, we’re spotlighting Hamilton Mountain, Stoney Creek, and Ancaster — three regions that stood out in both activity and pricing trends this month.
This closer look at sub-areas helps highlight where buyers may find opportunity and where seller pricing strategies will matter most.
Hamilton Mountain Sub-Area Breakdown
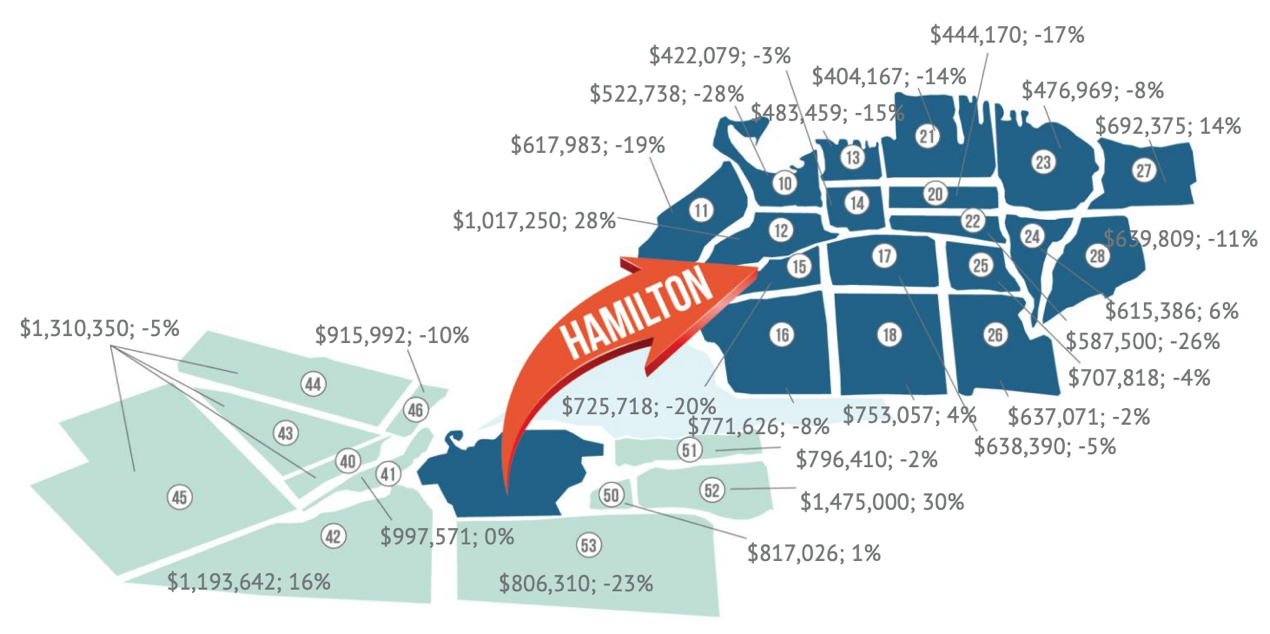
Hamilton Mountain (Areas 15, 16, 17, 18, 25, 26) remains the city’s most active region. Prices show mixed trends, with declines in most sub-areas and modest growth in one.
- Area 15: $725,718 (↓ 20%)
- Area 16: $771,626 (↓ 8%)
- Area 17: $638,390 (↓ 5%)
- Area 18: $753,057 (↑ 4%)
- Area 25: $707,818 (↓ 4%)
- Area 26: $637,071 (↓ 2%)
Standout Insight: Area 18 was the only sub-area to post growth this month, while Area 15 saw the steepest decline — underscoring the range of price movement across the Mountain.
Stoney Creek Sub-Area Breakdown
Stoney Creek (Areas 50, 51, 52) experienced some of the sharpest contrasts this month, with notable gains in Area 52 and softer pricing in others.
- Area 50: $817,026 (↑ 1%)
- Area 51: $796,410 (↓ 2%)
- Area 52: $1,475,000 (↑ 30%)
Standout Insight: Area 52 saw a 30% year-over-year increase, making it one of the strongest-performing sub-areas in Hamilton this month.
Ancaster Sub-Area Breakdown
Ancaster (Area 42) continued to lead the city in average pricing.
- Area 42: $1,193,642 (↑ 16%)
Standout Insight: Ancaster’s upward trend highlights steady buyer demand in the city’s higher-end market segment.
What This Means for Buyers and Sellers
Pricing trends remain mixed. Ancaster and Stoney Creek’s Area 52 are showing gains, while other areas soften. Buyers have new opportunities, and sellers need smart pricing strategies as the market shifts into fall.
Summary & Expert Insights – Hamilton Real Estate Market
September 2025 brought 773 residential sales to the Hamilton, Burlington, Haldimand County, and Niagara North market, marking the third consecutive month of year-over-year growth. While encouraging, activity still sits 27 per cent below long-term seasonal trends, reflecting a market that continues to stabilize at a slower pace.
New listings climbed to 2,188, pushing the sales-to-new listings ratio to 35 per cent and contributing to a further build-up in supply. Inventory levels rose, bringing months of supply to five, which is consistent with a more balanced, buyer-leaning market.
The unadjusted benchmark price for the region was $753,300, holding steady compared to August but still down more than 9 per cent year-over-year. In Hamilton, the benchmark price sat at $703,700, with an average price of $775,745, down 4.8 per cent annually. The most notable price resilience was seen in Ancaster and Stoney Creek’s Area 52, while segments like Hamilton Mountain saw broader softening.
“More inventory is creating opportunities for buyers, even as prices adjust,” says Nicolas von Bredow, spokesperson for the Cornerstone Association of REALTORS®. “Market conditions are becoming more balanced, with buyers having more choice and time to make informed decisions.”
What This Means for You
- For buyers: More listings and stable prices are giving buyers greater flexibility and leverage, especially in neighbourhoods with higher supply.
- For sellers: Pricing strategically is key to staying competitive, particularly in areas where inventory continues to rise.
- For investors: Ongoing price adjustments in some segments may present strategic opportunities.
These trends show a market that’s stabilizing rather than cooling — one where both buyers and sellers can benefit by acting strategically.
Thinking about buying or selling in Hamilton and the surrounding area?
The experienced sales representatives at Judy Marsales Real Estate Brokerage are here to help you navigate today’s market with confidence.
Ready to Buy or Sell in Hamilton? We’re Here to Help
Whether you’re searching for your dream home, planning your next move, or exploring investment opportunities, Judy Marsales Real Estate Brokerage is your trusted partner in Hamilton real estate.
With 37 years of local expertise, our sales representatives provide the insight, guidance, and strategy needed to navigate today’s evolving market — especially as elevated inventory and shifting buyer demand create new opportunities.
Why Work With Us
- Tailored Support: From first-time buyers to seasoned investors, we’re here to guide you every step of the way.
- Local Expertise: Deep knowledge of Hamilton’s neighbourhoods, pricing trends, and inventory gives you a clear advantage.
- Real-Time Listings: Access the latest homes, stats, and market insights in Hamilton, Ancaster, Dundas, and beyond.
Stay Connected
Follow us on Facebook and Instagram for:
- Monthly market updates and trends
- New listings as they hit the market
- Local stories from the Hamilton community
Get in Touch
Curious about your home’s value? Try our free Home Value Calculator for a quick estimate. Want more market insight? Explore Cornerstone’s full September report for prices, trends, and expert analysis.
Make your next move with confidence — partner with Judy Marsales Real Estate Brokerage, trusted experts in Hamilton real estate.