
Hamilton Real Estate Market Update – October 2025
The Cornerstone Association of REALTORS® (Cornerstone) has released its October 2025 real estate market statistics, revealing a market still adjusting to elevated supply and shifting economic conditions. A total of 757 homes were sold across Hamilton, Burlington, Haldimand County, and Niagara North, just slightly below September’s figure but still 34% under typical October levels. While activity remains steady month-to-month, year-over-year comparisons continue to show a slower fall season.
This Hamilton real estate market update for October 2025 will highlight:
- Key insights for buyers, sellers, and investors navigating changing conditions.
- Sales, new listings, and pricing activity across Hamilton and surrounding communities.
- Neighbourhood-level trends that are shaping market performance this fall.
High inventory continues to influence pricing, even after the recent Bank of Canada policy rate cut. “Persistently high supply levels compared to sales have put downward pressure on home prices this month,” says Nicolas von Bredow, Cornerstone spokesperson for the Hamilton-Burlington market area. “Many were hopeful the rate cut would attract more buyers; however, slowing economic conditions and a decrease in migration are likely continuing to weigh on confidence.”
New listing activity eased in October, with 1,778 homes added to the MLS® System, improving the sales-to-new listings ratio to 43%. This helped prevent further inventory gains, though overall supply remained steady at five months. Pricing also held stable. The unadjusted benchmark price reached $747,200, nearly unchanged from September but still nine per cent below October 2024.
As Cornerstone notes, conditions vary widely across local neighbourhoods and property types, highlighting the importance of working with a REALTOR® who understands area-specific trends. The statistics in this report are sourced from the ITSO MLS® System and reflect broader market patterns across the region.
Coming Up: A Closer Look at Hamilton’s Housing Market
Next, we’ll break down Hamilton’s residential sales performance, pricing trends, and district-level dynamics heading into late fall.
Hamilton Residential Real Estate – Price, Sales & Market Conditions
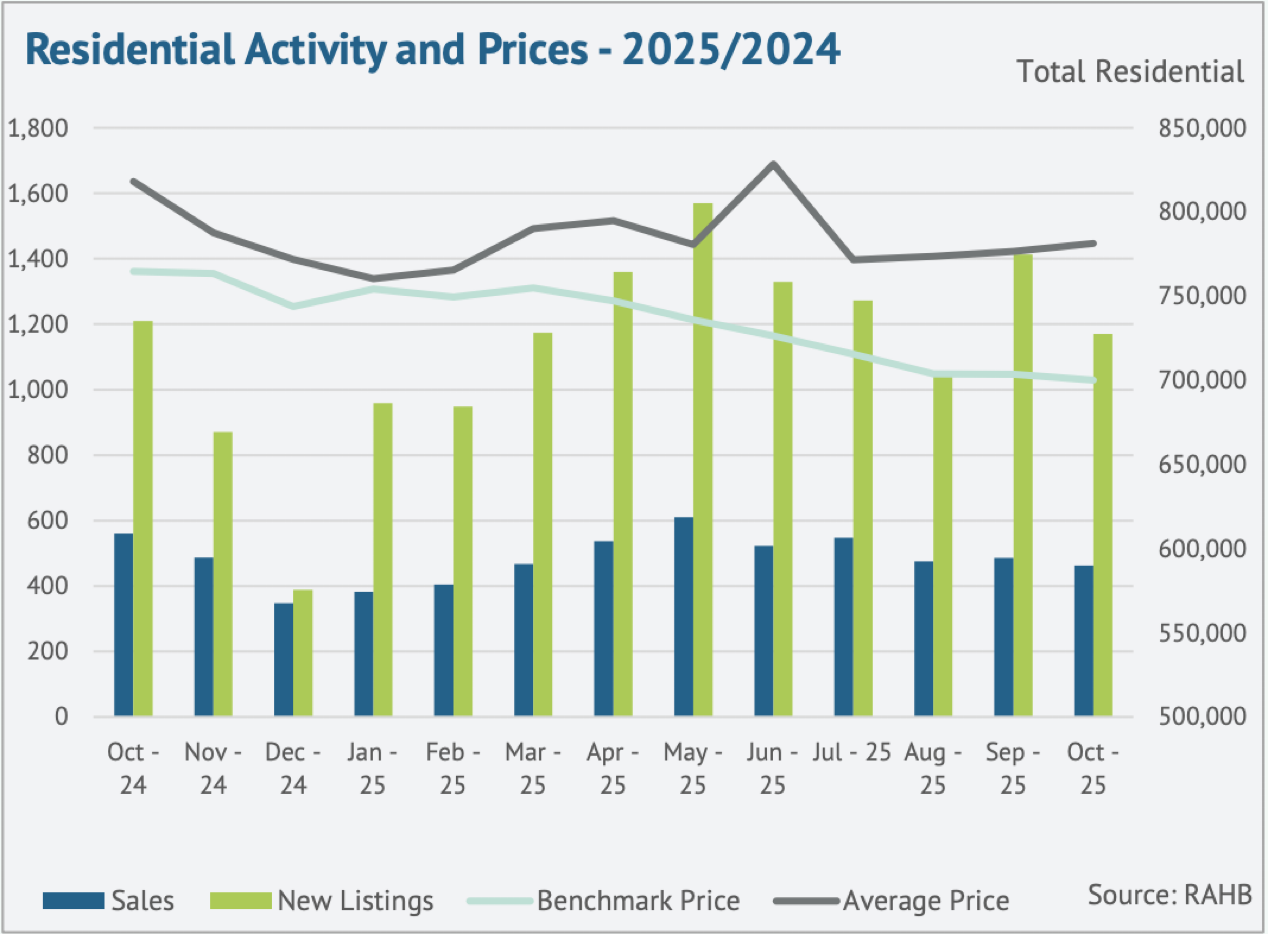
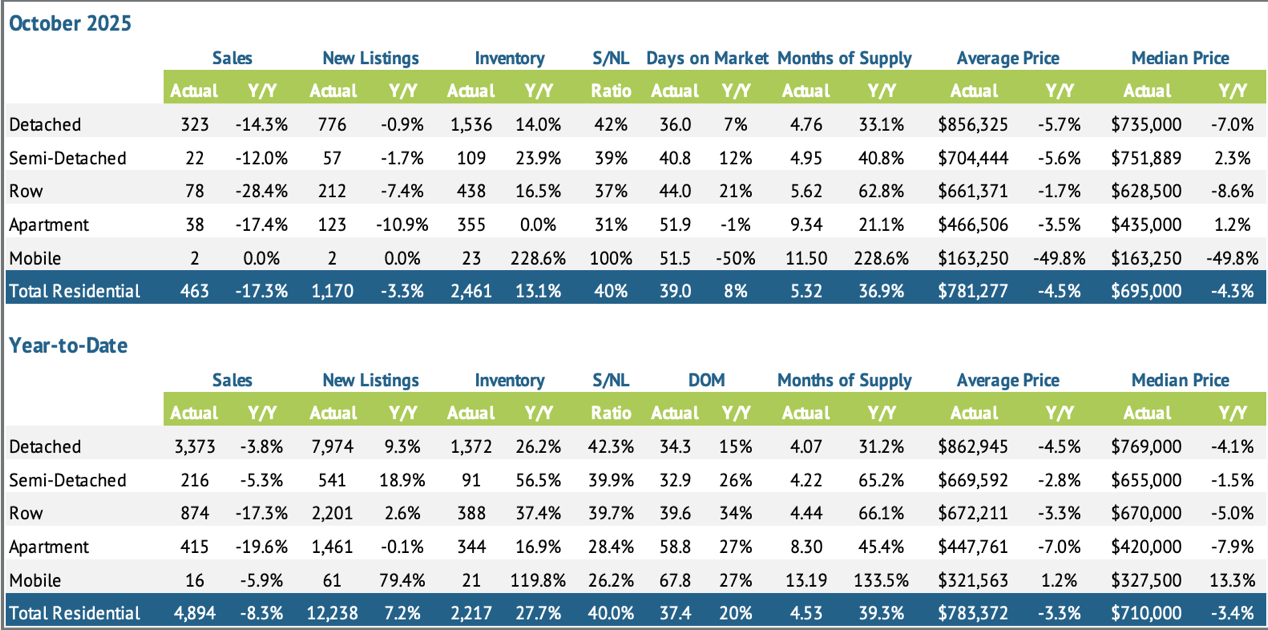
Hamilton’s residential real estate market saw a softer pace in October, with 463 sales across the city, a 17.3% decline year-over-year, and 12 fewer sales than September. Elevated supply and persistent affordability challenges continue to influence buyer behaviour heading into late fall. The average residential sale price reached $781,277, down 4.5% year-over-year, reflecting a market that is adjusting to higher inventory and more cautious demand.
While detached and semi-detached homes remain key contributors to overall activity, market conditions continue to favour buyers as supply levels outpace sales across several property types.
Inventory and Listing Activity
October saw a slowdown in new listings, which helped prevent additional inventory gains. Even so, supply levels remain elevated across several property types.
- New listings slowed: helping curb further increases in inventory.
- Sales-to-new listings ratio: 40%, indicating buyer-favouring conditions.
- Months of supply: 5 months, consistent with broader inventory buildup this fall.
- Oversupply pressure: Most evident in apartment-style and row-home segments.
- Most balanced submarket: Dundas, with 3 months of supply and a 63% sales-to-new listings ratio.
- Market variation: Conditions differ widely between neighbourhoods based on property type and supply levels.
Overall, supply levels continue to outpace demand in many segments, keeping the fall market balanced to slightly buyer-leaning.
Pricing Trends and Buyer Conditions
Elevated supply continued to weigh on prices in October, with varied impacts across Hamilton’s property types.
- Unadjusted benchmark price was $700,100:
- Slight month-over-month dip
- Down over 8% year-over-year
- Price adjustments by type:
- Apartment-style homes declined 14% year-over-year (largest decline)
- Detached homes declined 7% year-over-year
- Buyer conditions strengthened: More choice, longer decision windows, and increased negotiation leverage.
- Days on market: Increased, reflecting slower-moving fall activity.
These trends point to a market where pricing remains sensitive to supply, especially in higher-density segments with elevated inventory.
Looking Ahead: Property Type Breakdown
This concludes the overview of Hamilton’s residential market performance for October 2025. Next, we’ll explore how detached, semi-detached, townhome, and apartment-style properties performed individually, providing a clearer view of where opportunities may be emerging for buyers and sellers as we move toward year-end.
Hamilton Real Estate: Breakdown by Property Type – October 2025
October revealed clear differences in performance across Hamilton’s major property types. Detached homes continued to dominate total sales, while townhomes and apartments saw sharper declines. Inventory levels remain elevated in several segments, keeping pricing and days on market under downward pressure. Overall, the data reflects a fall market still shaped by high supply, affordability constraints, and cautious buyer behaviour.
Detached Homes
- Sales: 323 (↓ 14.3% YoY)
- New Listings: 776 (↓ 0.9%)
- Inventory: 1,536 (↑ 14%)
- Average Price: $856,325 (↓ 5.7%)
- Benchmark Price: $765,900 (↓ 7%)
Detached homes remain the most active segment, though sales softened and price adjustments continued as inventory rose.
Semi-Detached Homes
- Sales: 22 (↓ 12% YoY)
- New Listings: 57 (↓ 1.7%)
- Inventory: 109 (↑ 23.9%)
- Average Price: $704,444 (↓ 5.6%)
- Benchmark Price: $695,500 (↓ 5%)
Semi-detached activity slowed in October, with rising inventory and fewer new listings contributing to more cautious buyer movement and moderate price declines.
Row (Townhomes)
- Sales: 78 (↓ 28.4% YoY)
- New Listings: 212 (↓ 7.4%)
- Inventory: 438 (↑ 16.5%)
- Average Price: $661,371 (↓ 1.7%)
- Benchmark Price: $610,400 (↓ 5%)
Townhome demand declined sharply year-over-year. With supply increasing and new listings easing, market conditions remained competitive for sellers and continued to favour strategic pricing.
Apartments & Condos
- Sales: 38 (↓ 17.4% YoY)
- New Listings: 123 (↓ 10.9%)
- Inventory: 355 (no change)
- Average Price: $466,506 (↓ 3.5%)
- Benchmark Price: $402,900 (↓ 14%)
Apartments recorded the steepest benchmark decline among all property types, driven by elevated supply, affordability shifts, and slower absorption rates.
Coming Up: Regional Summary
Next, we’ll move into a regional breakdown across Hamilton’s key areas — including Hamilton Mountain, Stoney Creek, and Hamilton Centre — to show where demand is strengthening, softening, or balancing out as we head toward the end of 2025.
Regional Summary – October 2025
Hamilton’s housing market showed noticeable variation across key areas in October, with Hamilton Mountain once again leading the city in both sales and inventory. Stoney Creek and Hamilton Centre also saw elevated supply levels, contributing to slower absorption rates and increasing buyer choice. At the same time, Flamborough, Dundas, and Ancaster each posted average home prices above $1 million, highlighting the continued strength of Hamilton’s upper-end market despite softer sales activity.
Overall, these trends reinforce a fall market shaped by rising supply, price adjustments, and more negotiating power for buyers across several neighbourhoods.
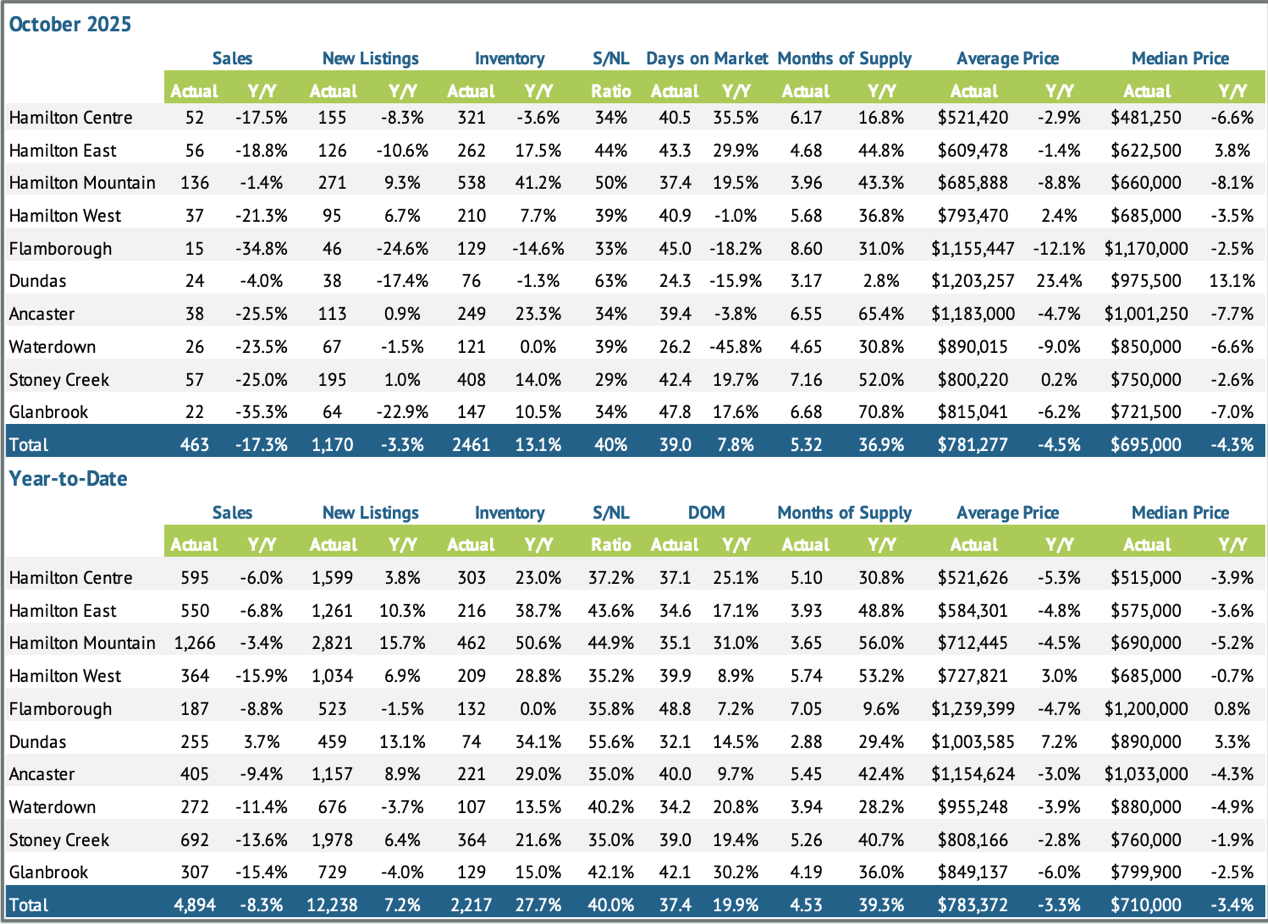
Hamilton Mountain
Hamilton Mountain remained Hamilton’s highest-volume district, leading the city in both sales and active listings.
- Sales: 136 (↓ 1.4%)
- New Listings: 271 (↑ 9.3%)
- Inventory: 538 (↑ 3.6%)
- Months of Supply: 3.96
- Average Price: $685,888 (↓ 8.8%)
With strong activity but growing inventory, the Mountain continues to offer a wide range of options for buyers, contributing to balanced conditions heading into year-end.
Stoney Creek
Stoney Creek saw softer sales in October but posted one of the highest inventory levels city-wide, second only to Hamilton Mountain.
- Sales: 57 (↓ 25%)
- New Listings: 195 (↑ 1%)
- Inventory: 408 (↑ 14%)
- Months of Supply: 7.16
- Average Price: $800,220 (↑ 2%)
Elevated supply and rising months of inventory continue to support buyer-friendly conditions, even as the average price saw a modest year-over-year increase.
Hamilton Centre
Hamilton Centre experienced slower sales alongside one of the highest months-of-supply totals in the city.
- Sales: 52 (↓ 17.5%)
- New Listings: 155 (↓ 8.3%)
- Inventory: 321 (↑ 3.6%)
- Months of Supply: 6.17
- Average Price: $521,420 (↓ 2.9%)
Higher inventory and moderate price adjustments continue to make Hamilton Centre one of the most accessible and negotiable areas for buyers this fall.
Upper-End Market Snapshot: Flamborough, Dundas & Ancaster
Flamborough, Dundas, and Ancaster each held firmly in Hamilton’s luxury tier in October, recording average home prices above $1 million. Flamborough reported an average price of $1,155,447 (↓ 12.1%), supported by 15 sales and 8.60 months of supply, indicating slower absorption in this rural high-end segment. Dundas, the most balanced of the three, posted 24 sales, 3.17 months of supply, and an average price of $1,203,257, reflecting strong demand and notable price resilience. Ancaster saw 38 sales, 6.55 months of supply, and an average price of $1,183,000 (↓ 4.7%), supported by steady listing activity and ongoing upper-market appeal.
Together, these areas continue to define Hamilton’s premium housing market, where million-dollar pricing remains a consistent feature despite shifting sales volumes and evolving fall market conditions.
Looking Ahead: Average Residential Prices by District
Next, we’ll take a closer look at average residential sale prices by district, continuing our focus on Hamilton Mountain, Stoney Creek, and Hamilton Centre. This breakdown will highlight how pricing is shifting in the city’s most active and supply-sensitive areas as we move deeper into the fall market.
Average Residential Prices by District – October 2025
Average sale prices across Hamilton’s districts continued to vary widely in October, highlighting a market where some neighbourhoods are still adjusting while others are showing signs of stability. This month, we’re again focusing on Hamilton Mountain, Stoney Creek, and including Hamilton Centre. These three regions that stand out for their activity levels, inventory supply, and the diversity of price movement across their sub-areas.
Understanding these micro-trends gives buyers and sellers a clearer picture of where opportunities may emerge and where strategic pricing will be most important this fall.
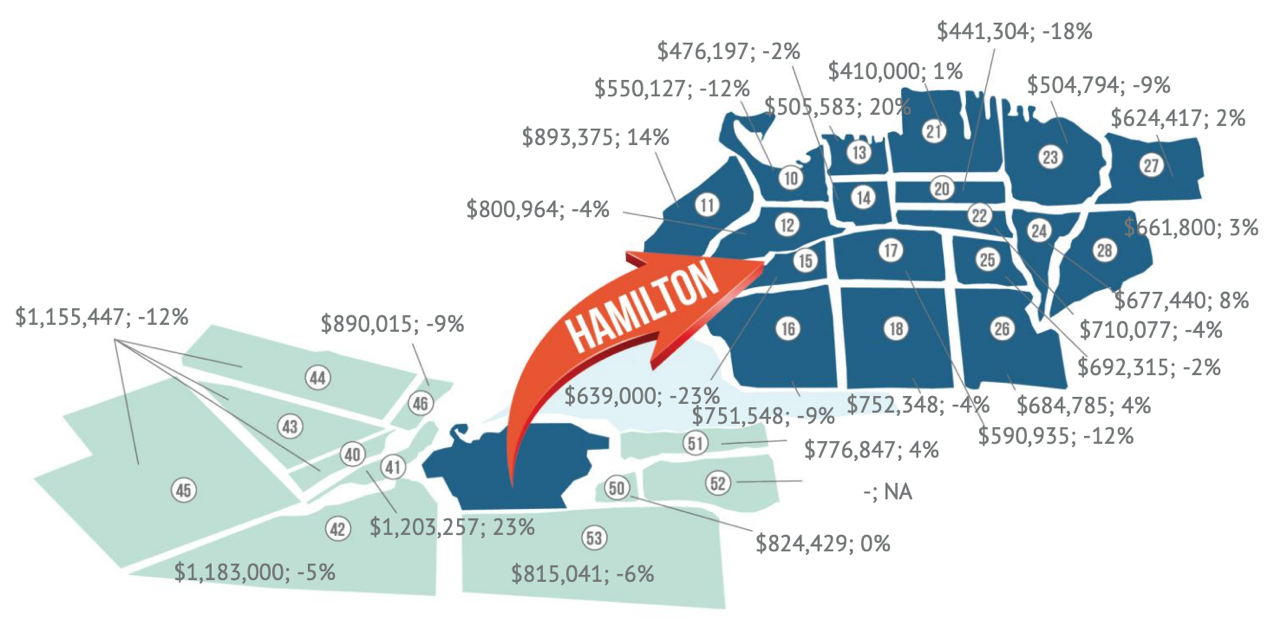
Hamilton Mountain Sub-Area Breakdown
Hamilton Mountain (Areas 15, 16, 17, 18, 25, 26) remained the city’s strongest overall district in terms of sales and inventory. Price adjustments continued across most sub-areas, with one exception.
- Area 15: $639,000 (↓ 23%)
- Area 16: $751,548 (↓ 9%)
- Area 17: $590,935 (↓ 12%)
- Area 18: $752,348 (↓ 4%)
- Area 25: $692,315 (↓ 2%)
- Area 26: $684,785 (↑ 4%)
Standout Insight: Area 26 was the only Mountain sub-area to post a price increase this month, while Area 15 experienced the steepest decline, emphasizing how pricing conditions differ even within the city’s highest-activity district.
Stoney Creek Sub-Area Breakdown
Stoney Creek (Areas 50, 51, 52) saw a mix of stability and growth in October, with two sub-areas reporting steady or rising prices.
- Area 50: $824,429 (0%)
- Area 51: $776,847 (↑ 4%)
- Area 52: NA
Standout Insight: Area 51 continued to show upward movement with a 4% year-over-year gain, while Area 50 held steady — a positive sign in a district with one of the highest months-of-supply totals in the city.
Hamilton Centre Sub-Area Breakdown
Hamilton Centre (Areas 13, 14, 20, 21, 22) recorded some of the city’s sharpest contrasts, with several declines offset by a notable gain in Area 13.
- Area 13: $505,583 (↑ 20%)
- Area 14: $476,197 (↓ 2%)
- Area 20: $441,304 (↓ 18%)
- Area 21: $410,000 (↑ 1%)
- Area 22: $710,077 (↓ 4%)
Standout Insight: Area 13’s 20% increase was the strongest gain across all Hamilton Centre sub-areas, while Area 20 saw the most significant decline, illustrating the wide pricing range within this centrally located district.
What This Means for Buyers and Sellers
October’s district-level pricing shows that Hamilton continues to adjust unevenly, with some areas stabilizing and others experiencing more pronounced shifts. Hamilton Mountain remains the city’s core driver of activity, Stoney Creek is showing resilience in select sub-areas despite high supply, and Hamilton Centre offers some of the city’s most accessible price points alongside isolated pockets of growth. For buyers, these variations open up new opportunities; for sellers, thoughtful pricing and market-specific strategies remain key as the fall market progresses.
Summary & Expert Insights – Hamilton Real Estate Market
October 2025 closed with 757 residential sales across the Hamilton, Burlington, Haldimand County, and Niagara North region—slightly below September and well under long-term seasonal averages. New listings eased to 1,778, improving the sales-to-new listings ratio to 43%, while overall inventory held steady at five months of supply, reinforcing the balanced-to-buyer-leaning conditions seen throughout the fall.
The region’s unadjusted benchmark price reached $747,200, holding steady month-over-month but remaining nine per cent below last year. Within Hamilton, the benchmark price dipped to $700,100, while the average residential price settled at $781,277, a 4.5% year-over-year decline, reflecting the broader softness across several property types.
“High supply compared to sales continues to shape pricing this month,” says Nicolas von Bredow, Cornerstone spokesperson. “While activity has been steady, many buyers remain cautious due to economic conditions, which is contributing to more balanced market dynamics.”
What This Means for You
- Buyers: More choice, more time, and more negotiating power—particularly in areas with elevated inventory such as Hamilton Mountain, Stoney Creek, and Hamilton Centre.
- Sellers: Strategic pricing remains essential as buyers compare more options and market conditions continue to favour balance.
- Investors: Price adjustments in select segments may offer new opportunities as the market stabilizes.
Moving Forward: Expert Support for Every Step
As market conditions continue to evolve, having the guidance of a knowledgeable, community-rooted real estate expertise is essential. With decades of experience across Hamilton’s diverse neighbourhoods, our sales representatives are here to help you make informed, confident decisions—whether you’re planning to buy, sell, or simply assess your next steps.
Ready to Buy or Sell in Hamilton? We’re Here to Help
Whether you're preparing to make a move, searching for the right home, or exploring investment opportunities, Judy Marsales Real Estate Brokerage is your trusted partner in Hamilton real estate. With more than 37 years of community-focused experience, our brokerage offers the local insight, market knowledge, and personalized guidance you need in today’s evolving conditions.
Why Work With Us
- Tailored Support: From first-time buyers to long-time homeowners, we’re here for every stage of your journey.
- Local Expertise: Deep understanding of Hamilton’s neighbourhoods, pricing trends, and inventory levels.
- Real-Time Listings: Stay connected to the newest homes, stats, and market activity across Hamilton, Ancaster, and Dundas.
Stay Connected
Follow us on Facebook and Instagram for:
- Monthly market updates
- New listings and open houses
- Local stories and community insights
Get in Touch
Curious about your home’s value? Try our free Home Value Calculator for an instant estimate. Looking for deeper insights? Explore Cornerstone’s full October market report for comprehensive regional trends.
Make your next move with confidence — partner with Judy Marsales Real Estate Brokerage, trusted experts in Hamilton’s real estate community.