
Hamilton Real Estate Market Update – November 2025
The Cornerstone Association of REALTORS® (Cornerstone) has released its November 2025 real estate statistics, revealing a market continuing to rebalance as winter approaches. A total of 624 homes sold across Hamilton, Burlington, Haldimand County, and Niagara North—reflecting the typical seasonal slowdown and contributing to a 12 per cent year-to-date decline in overall sales activity. While demand has eased, market conditions remain stable, with buyers benefiting from improved selection and more time to make decisions.
This Hamilton real estate market update for November 2025 will highlight:
- Stand-out market shifts that shaped November’s performance.
- How sales, new listings, and inventory levels evolved as winter nears.
- Pricing trends and what they mean for buyers and sellers navigating today’s market.
According to Cornerstone spokesperson Nicolas von Bredow, the region is experiencing a more balanced environment after years of intense competition. “Although sales and new listings are down, this is typical as we enter the winter months. We have inventory that is still higher than long-term trends, creating opportunities for those who have been waiting on the sidelines,” he explains. Homes are also taking longer to sell, giving buyers greater negotiating room and reducing the pressure of bidding-war conditions.
Sellers, meanwhile, continue to adjust their expectations from the peak prices of 2022. Well-priced homes are still attracting interest, but elevated supply remains a defining factor. New listings eased compared to last year, bringing the sales-to-new-listings ratio to 50 per cent. Inventory levels, although down slightly from October, are still higher than last year and 68 per cent above long-term trends, reinforcing balanced conditions across the region.
Year-to-date, the average unadjusted benchmark price sits at $775,464, nearly five per cent lower than 2024. Pricing stability continues to vary by district and property type—making local expertise essential when interpreting today’s market signals.
The statistics in this report are sourced from the ITSO MLS® System and reflect broader market patterns across the region.
Coming Up: Key Highlights From November’s Market Performance
Next, we’ll identify the month’s stand-out metrics and explore the factors shaping buyer and seller behaviour heading into the winter season.
Hamilton Residential Real Estate: Price, Sales & Market Conditions
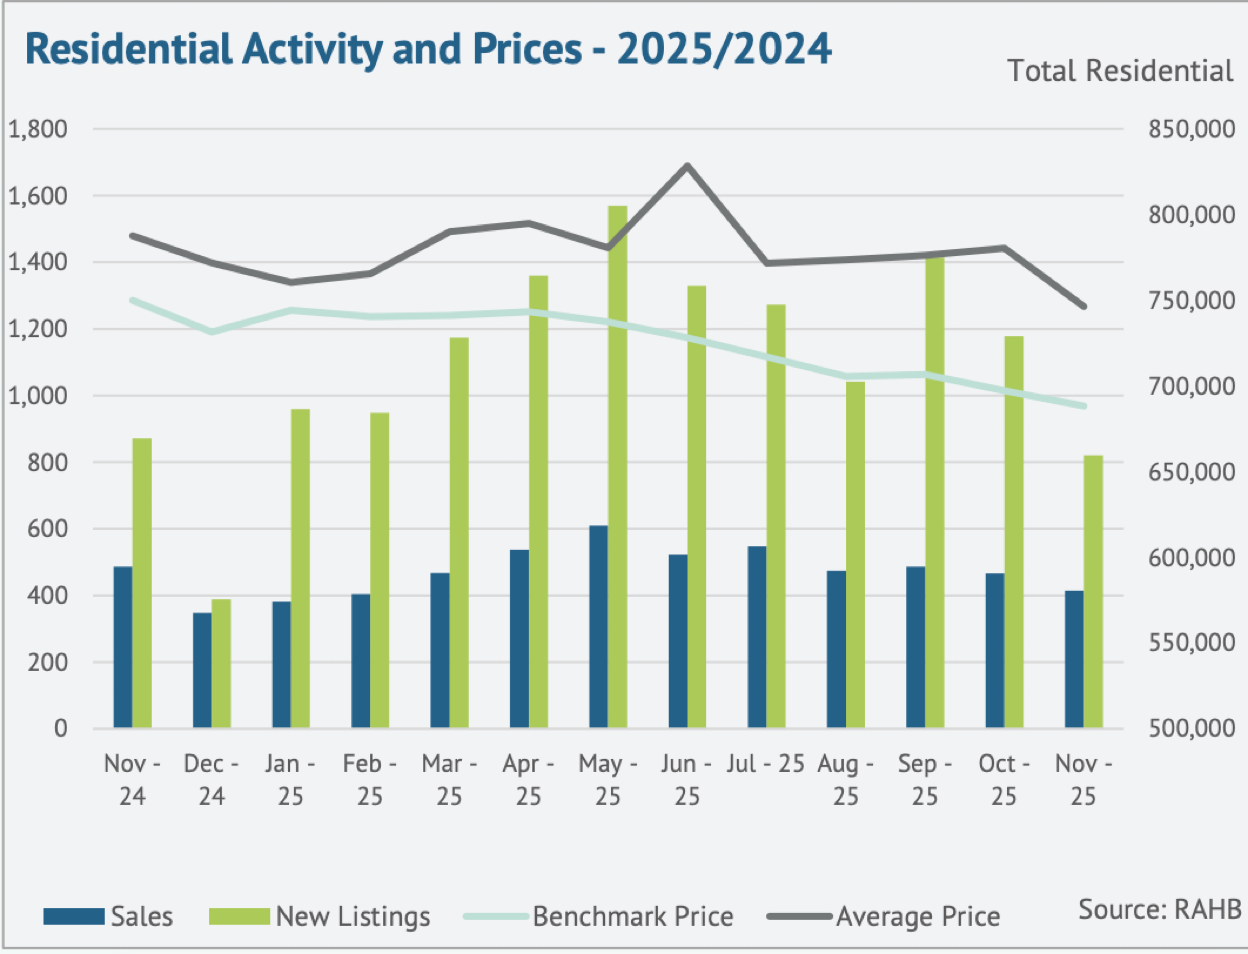
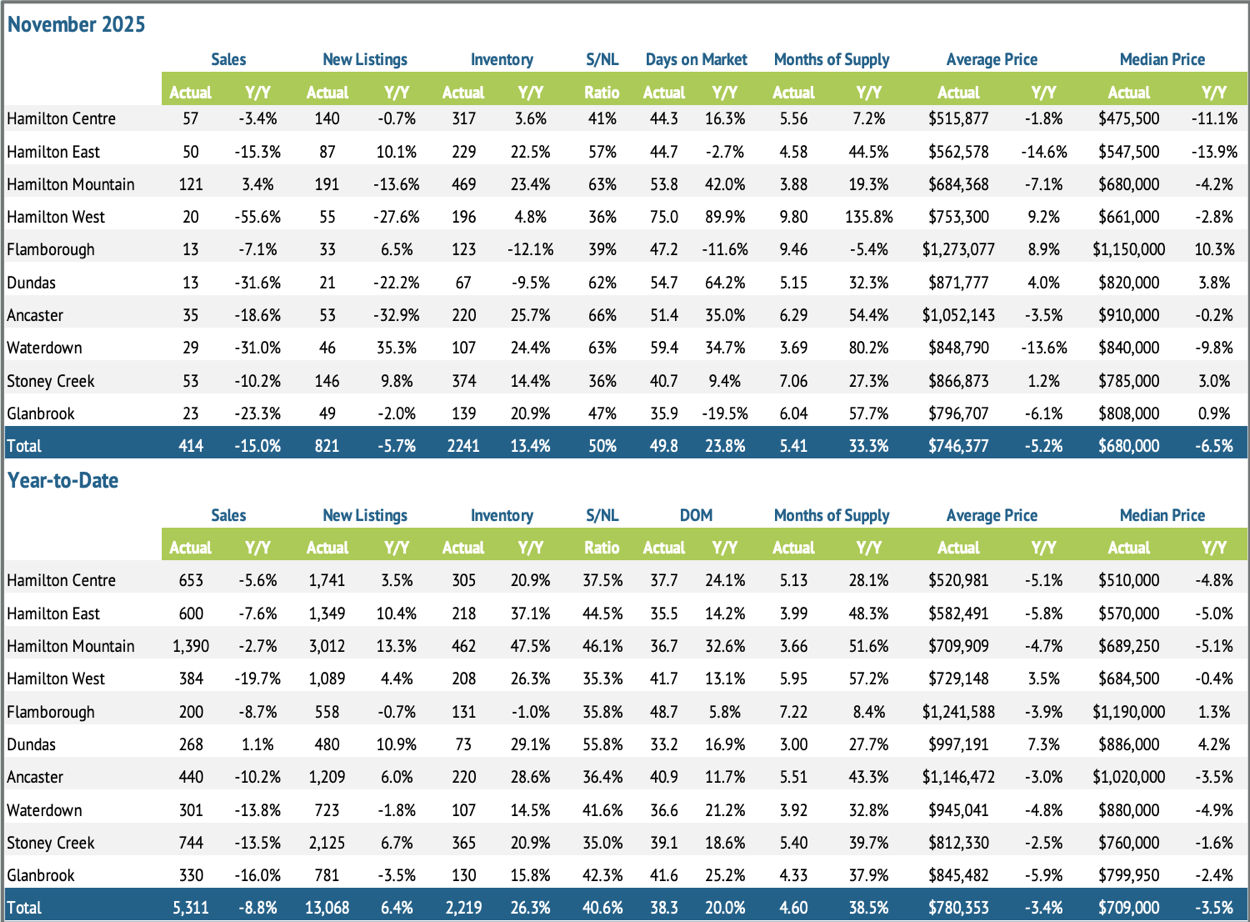
Hamilton’s residential real estate market saw another slowdown in November, with 414 sales, marking a 15 per cent decline year-over-year and one of the lowest November totals in more than a decade. Demand continues to be tempered by affordability challenges, higher borrowing costs, and broader economic uncertainty, contributing to a nine per cent year-to-date decline in overall sales. The average residential price across Hamilton reached $746,377, down 5.2 per cent year-over-year, reflecting a market that is adjusting to elevated inventory and more cautious buyer behaviour.
As seen throughout the fall, quieter conditions are giving buyers more time to make decisions, negotiate, and evaluate options, while sellers continue to recalibrate pricing expectations to align with shifting market trends.
Inventory and Listing Activity
November saw a continued easing in new listings, contributing to a modest pullback in overall supply. Even so, inventory remains elevated compared to last year and well above long-term trends.
Key listing and inventory indicators:
- New listings: 821 units, down 5.7% year-over-year.
- Sales-to-new listings ratio: 50%, representing regional balance and similar buyer-leaning trends within Hamilton.
- Inventory: 2,241 active listings, up 13.4% year-over-year.
- Months of supply: 5.4 months, a 33.3% increase from last year.
While new listing activity has eased, the pullback in demand is the primary factor holding inventory levels high. Oversupply remains most noticeable in higher-density segments such as apartment-style units, where price adjustments continue to be more substantial.
Market conditions vary across neighbourhoods, with several areas showing steadier absorption, while others are experiencing slower turnover heading into winter.
Pricing Trends and Buyer Conditions
The unadjusted benchmark price for November settled at $688,300, an 8 per cent decline year-over-year and nearly 5 per cent lower year-to-date. Price softness continues across property types, with the largest declines occurring in apartment-style homes. Detached and semi-detached properties remain more resilient but are still adjusting to elevated supply and slower sales activity.
Additional pricing insights:
- Prices declined across all major property types, reflecting reduced competition and increased negotiation room.
- Apartment-style units recorded the most significant annual price drops.
- Days on market increased to 49.8 days (up 23.8% year-over-year), highlighting longer decision timelines and more selective buyer behaviour.
Overall, November’s pricing trends reinforce a market where buyers hold more leverage, while sellers must remain strategic with pricing and presentation to attract qualified purchasers.
Looking Ahead: Property Type Breakdown
This overview sets the stage for a more detailed examination of how detached, semi-detached, townhome, and apartment-style properties performed in November. Understanding these differences will help clarify where opportunities may be emerging for both buyers and sellers as we move through the winter market.
Hamilton Real Estate: Breakdown by Property Type: November 2025

November showed varying performance across Hamilton’s major property types, with detached homes remaining the most active segment and higher-density housing seeing the sharpest slowdowns. Elevated inventory and softer demand continued to influence pricing and buyer conditions across the board.
Below, we take a closer look at how each property type performed and where the most notable shifts occurred this month.
Detached Homes
- Sales: 305 (↓ 1.3% YoY)
- New Listings: 567 (↑ 1.4%)
- Inventory: 1,368 (↑ 12%)
- Average Price: $818,353 (↓ 7.1%)
- Benchmark Price: $769,200 (↓ 8%)
Detached homes remained steady, with sales holding close to last year’s levels. Rising inventory is contributing to ongoing price adjustments, giving buyers more negotiating power and longer decision windows.
Semi-Detached Homes
- Sales: 15 (↓ 34.8% YoY)
- New Listings: 36 (↓ 2.7%)
- Inventory: 102 (↑ 27.5%)
- Average Price: $501,927 (↓ 24.6%)
- Benchmark Price: $681,700 (↓ 7%)
Semi-detached activity slowed sharply, with higher inventory and fewer sales putting clear downward pressure on prices. Buyer conditions remained favourable as demand eased.
Row (Townhomes)
- Sales: 63 (↓ 37.6% YoY)
- New Listings: 138 (↓ 17.4%)
- Inventory: 408 (↑ 21.1%)
- Average Price: $632,903 (↓ 8.9%)
- Benchmark Price: $585,900 (↓ 8%)
Townhomes saw significant declines in both sales and pricing. Elevated supply combined with moderating demand continued to create competitive conditions for sellers.
Apartments & Condos
- Sales: 31 (↓ 41.5% YoY)
- New Listings: 77 (↓ 23.8%)
- Inventory: 338 (↑ 3.7%)
- Average Price: $387,113 (↓ 20.5%)
- Benchmark Price: $393,700 (↓ 12%)
Apartments recorded the steepest pullback, with sales and prices falling more than any other segment. Softer demand and higher relative supply continue to weigh on this category.
Coming Up: Regional Summary – November 2025
Next, we’ll move into a detailed regional breakdown across Hamilton’s key districts for November—Hamilton Mountain, Hamilton West, and Ancaster. This overview will highlight how prices, sales activity, and market conditions are evolving at the neighbourhood level, revealing where demand is holding steady, where softness persists, and where balanced conditions are emerging as we head toward the end of 2025.
Regional Summary: November 2025
Hamilton’s housing market continued to show notable variation across districts in November, with several stand-out trends shaping overall performance. Hamilton Mountain once again led the city in total sales, reinforcing its position as Hamilton’s highest-volume and most active residential area. At the opposite end of the spectrum, Hamilton West experienced the steepest sales decline, recording the sharpest drop in year-over-year activity among all districts. Meanwhile, Ancaster reported the largest increase in inventory, underscoring the continued buildup of supply in Hamilton’s upper-end suburban markets.
Price trends also varied widely across the city. While many districts saw year-over-year declines, several areas reported notable price growth, including Hamilton West, Flamborough, Dundas, and Stoney Creek—all posting average price increases despite softer sales activity. These gains highlight ongoing demand for specific neighbourhoods and property types, even as broader market conditions remain balanced to buyer-leaning.
Key District Highlights
To better understand how market conditions varied across the city this month, here are the standout district-level shifts that had the greatest impact on Hamilton’s housing landscape. These highlights showcase where demand strengthened, where supply increased, and which neighbourhoods demonstrated unexpected resilience in pricing.
Hamilton Mountain – Highest Sales Volume
- 121 sales (+3.4% YoY), the most of any district in November.
- Hamilton Mountain continues to anchor Hamilton’s residential market, with steady demand and strong turnover contributing to consistently high sales activity.
Hamilton West – Steepest Sales Decline
- 20 sales (↓ 55.6% YoY), the largest year-over-year drop city-wide.
- This significant slowdown reflects shifting demand dynamics in a district that typically sees varied activity tied to student housing, investment properties, and character neighbourhoods.
Ancaster – Largest Inventory Increase
- 220 active listings (+25.7% YoY), the biggest inventory jump of any district.
- The rise in supply is contributing to more balanced conditions in this higher-end market, offering buyers greater choice heading into winter.
Districts with Price Growth
Despite broader market softness, several districts posted year-over-year average price increases:
- Hamilton West: $753,300 (+9.2%)
- Flamborough: $1,273,077 (+8.9%)
- Dundas: $871,777 (+4.0%)
- Stoney Creek: $866,873 (+1.2%)
These price gains highlight the resilience of upper-tier and lifestyle-oriented neighbourhoods, where unique housing stock and strong community appeal continue to support values.
Looking Ahead: Average Residential Price by District
Next, we’ll break down average residential prices across Hamilton Mountain, Hamilton West, Ancaster, and Stoney Creek, offering a closer look at how pricing is shifting within Hamilton’s most active and supply-sensitive areas as we move toward year-end.
Average Residential Prices by District: November 2025
Average sale prices continued to show meaningful variation across Hamilton’s districts in November, reflecting a market where some neighbourhoods are seeing renewed strength while others continue to adjust to softer demand and elevated supply. This month, we’re focusing on Hamilton Mountain, Hamilton West, Stoney Creek, and Ancaster/Flamborough—districts that stood out for their activity levels, pricing shifts, and contrasting sub-area performance.
Understanding these micro-level differences helps buyers and sellers identify emerging opportunities and better navigate the closing months of 2025.
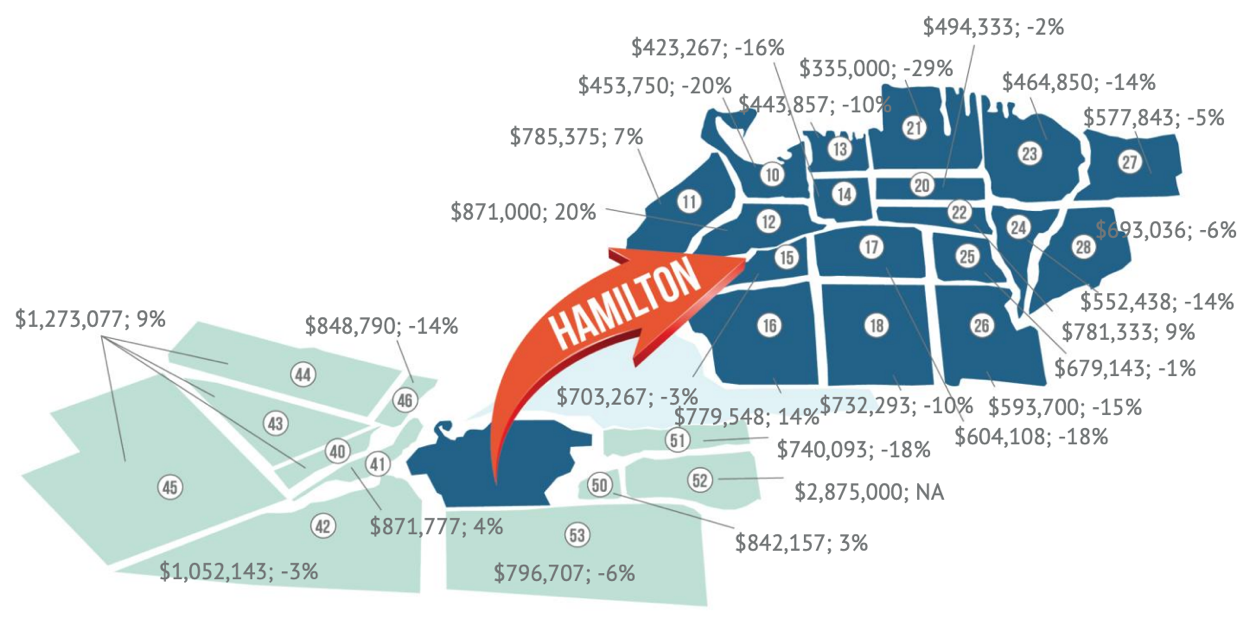
Hamilton Mountain – Sub-Area Breakdown
Hamilton Mountain (Areas 15, 16, 17, 18, 25, 26) remained Hamilton’s strongest district by sales volume. Price movement varied widely across sub-areas, underscoring the diversity of housing stock and buyer demand on the Mountain.
- Area 15: $703,267 (↓ 3%)
- Area 16: $779,548 (↑ 14%)
- Area 17: $604,108 (↓ 18%)
- Area 18: $732,293 (↓ 10%)
- Area 25: $679,143 (↓ 1%)
- Area 26: $593,700 (↓ 15%)
Standout Insight: Area 16 posted the strongest growth on the Mountain with a 14% increase, while Areas 17 and 26 saw notable declines, highlighting how pricing conditions can vary dramatically even within the city’s most active district.
Hamilton West – Sub-Area Breakdown
Hamilton West (Areas 10, 11, 12) recorded one of the most mixed price performances this month, ranging from a steep decline to some of the largest gains city-wide.
- Area 10: $453,750 (↓ 20%)
- Area 11: $785,375 (↑ 7%)
- Area 12: $871,000 (↑ 20%)
Standout Insight: Area 12 recorded a strong 20% increase, one of the highest across the city for November, even as overall sales in Hamilton West declined sharply.
Stoney Creek – Sub-Area Breakdown
Stoney Creek (Areas 50, 51, 52) saw a combination of stability, decline, and an outlier high-value sale affecting average pricing.
- Area 50: $842,157 (↑ 3%)
- Area 51: $740,093 (↓ 18%)
- Area 52: $2,875,000 (N/A)
Standout Insight: Area 50 continues to show modest growth despite elevated supply levels in Stoney Creek, while Area 52 recorded an exceptionally high sale price, increasing the average but not comparable year-over-year due to limited activity.
Ancaster & Flamborough – Upper-End Market Snapshot
These areas continue to define Hamilton’s upper-tier market, each posting average prices well above $1 million.
- Ancaster (Area 42): $1,052,143 (↓ 3%)
- Flamborough (Areas 40, 43–45): $1,273,077 (↑ 9%)
Standout Insight: Flamborough recorded one of the strongest increases across all districts this month, reinforcing persistent demand for rural and estate-style properties.
What This Means for Buyers and Sellers
November’s pricing trends show uneven adjustments across Hamilton. The Mountain remains the most active district, Hamilton West shows pockets of strength, and Ancaster and Flamborough continue to anchor the upper-end market. These variations highlight where buyer opportunities and strategic pricing considerations matter most heading into year-end.
Summary & Expert Insights: Hamilton Real Estate Market
November closed with 624 residential sales across the region, reflecting a typical seasonal slowdown and activity levels still below long-term averages. New listings eased, bringing the sales-to-new listings ratio to 50 per cent, while elevated inventory continued to support balanced-to-buyer-leaning conditions. Hamilton’s benchmark price settled at $688,300, an eight per cent decline year-over-year, with apartment and townhouse segments seeing the most significant adjustments.
“We’re seeing a more balanced market right now, giving buyers more breathing room than in previous years,” says Nicolas von Bredow, Cornerstone spokesperson. “Inventory remains higher than long-term trends, which is creating real opportunities for those who’ve been waiting for the right moment.”
What This Means for You
- Buyers: More choice and stronger negotiating conditions across several districts.
- Sellers: Pricing strategically remains essential as buyers compare more options.
- Investors: Softer prices in select segments may offer new opportunities.
Moving Forward
As the market continues to adjust, the guidance of an experienced, community-focused REALTOR is essential. Judy Marsales Real Estate Brokerage is here to help you make informed decisions—whether you’re buying, selling, or planning your next move.
Ready to Buy or Sell in Hamilton? We’re Here to Help
Whether you're preparing for a move, searching for the right home, or assessing investment opportunities, Judy Marsales Real Estate Brokerage is your trusted partner in Hamilton real estate. With more than 37 years of community-focused experience, our team provides the local insight, market knowledge, and personalized guidance you need in today’s evolving conditions.
Why Work With Us
- Tailored Support: From first-time buyers to long-time homeowners, we’re here for every stage of your journey.
- Local Expertise: Deep understanding of Hamilton’s neighbourhoods, pricing trends, and inventory levels.
- Real-Time Listings: Stay connected to the newest homes, stats, and market activity across Hamilton, Ancaster, and Dundas.
Stay Connected
Follow us on Facebook and Instagram for:
- Monthly market updates
- New listings and open houses
- Local stories and community insights
Get in Touch
Curious about your home’s value? Try our free Home Value Calculator for an instant estimate. Looking for deeper insights? Explore Cornerstone’s full November market report for comprehensive regional trends.
Make your next move with confidence — partner with Judy Marsales Real Estate Brokerage, trusted experts in Hamilton’s real estate community.