
Hamilton Real Estate Market Update – July 2025
The Cornerstone Association of REALTORS® (Cornerstone) has released its July 2025 real estate statistics, marking the first year-over-year sales increase since the end of 2024. Sales across the Hamilton-Burlington market area rose 5.5 per cent compared to July 2024, offering a welcome change from the steady declines seen over the past year. While this increase is a hopeful sign of market recovery, year-to-date activity remains below long-term averages.
This real estate market report for Hamilton in July 2025 will cover:
- Hamilton Real Estate Market Update – July 2025: Key insights for buyers, sellers, and investors navigating current market conditions.
- Sales, Listings, and Inventory: Regional statistics organized by property type and location.
- Sales, Regional, and Inventory Breakdown – Cornerstone Real Estate Market Area.
In July 2025, there were 886 residential sales across the Cornerstone market area, which includes Hamilton, Burlington, Haldimand County, and Niagara North. Sales were up month-over-month and posted the first year-over-year gain since late 2024. Year-to-date, 5,408 units were sold, 16 per cent lower than last year and 36 per cent below the 10-year average.
The number of new listings slowed in July, raising the sales-to-new listings ratio to 46 per cent. Months of supply decreased slightly to 4.4 months but remained elevated, suggesting balanced-to-buyer-favoured conditions in many areas.
The unadjusted benchmark price for the region was $763,700, down from June and more than nine per cent lower than July 2024. Softer pricing was recorded across most property types and locations, creating opportunities for buyers ready to act.
Coming Up: A Detailed Look at Hamilton’s Housing Market
The next section of this report breaks down property-specific data for the City of Hamilton, including residential sales, inventory levels, and benchmark prices by property type and district.
Hamilton Residential Real Estate – Price, Sales & Market Conditions

In July 2025, Hamilton’s residential real estate market recorded 529 sales, a modest 2.3 per cent increase compared to the same month last year. This marks a rare year-over-year gain in what has otherwise been a slower-paced year for the city’s housing market.
Much of July’s lift came from stronger activity in detached and semi-detached home sales, while other property types remained more subdued. Even with the month’s improvement, total sales so far in 2025 continue to trail long-term averages, highlighting the lasting impact of higher borrowing costs and shifting buyer priorities.
Inventory and Listing Activity
July brought 1,257 new listings to Hamilton, a slight dip from June’s totals but virtually the same as this time last year. With the small bump in sales activity, the sales-to-new listings ratio edged up to 42 per cent, still well below what would be considered a seller’s market, but a sign of slightly more balanced conditions.
Active inventory sat at 2,506 listings by the end of the month, up more than 25 per cent from July 2024. This brought the months of supply to 4.7, a year-over-year increase of 22.5 per cent. For buyers, that means more choice and potentially more negotiating room; for sellers, it underscores the importance of strategic pricing and presentation in a competitive environment.
Pricing Trends and Buyer Conditions
The average residential sale price in Hamilton was $767,654 in July, down 2.9 per cent compared to the same month last year. The benchmark price also eased, landing at $715,500, a decline from June and more than 8 per cent lower year-over-year. Price adjustments were seen across all property types, with apartment-style homes seeing the steepest declines.
Homes also took longer to sell, with the average days on market (DOM) rising to 37.9, an increase of more than 35 per cent compared to last year. This extra time on the market, combined with higher inventory, continues to tilt conditions in favour of buyers who are ready to make competitive offers.
Looking Ahead: Property Type Breakdown
This concludes our overview of Hamilton’s overall residential market performance for July 2025. In the next section, we’ll look at how different property types, including detached, semi-detached, townhomes, and apartment-style properties are performing across the city.
Breakdown by Property Type – Hamilton July 2025
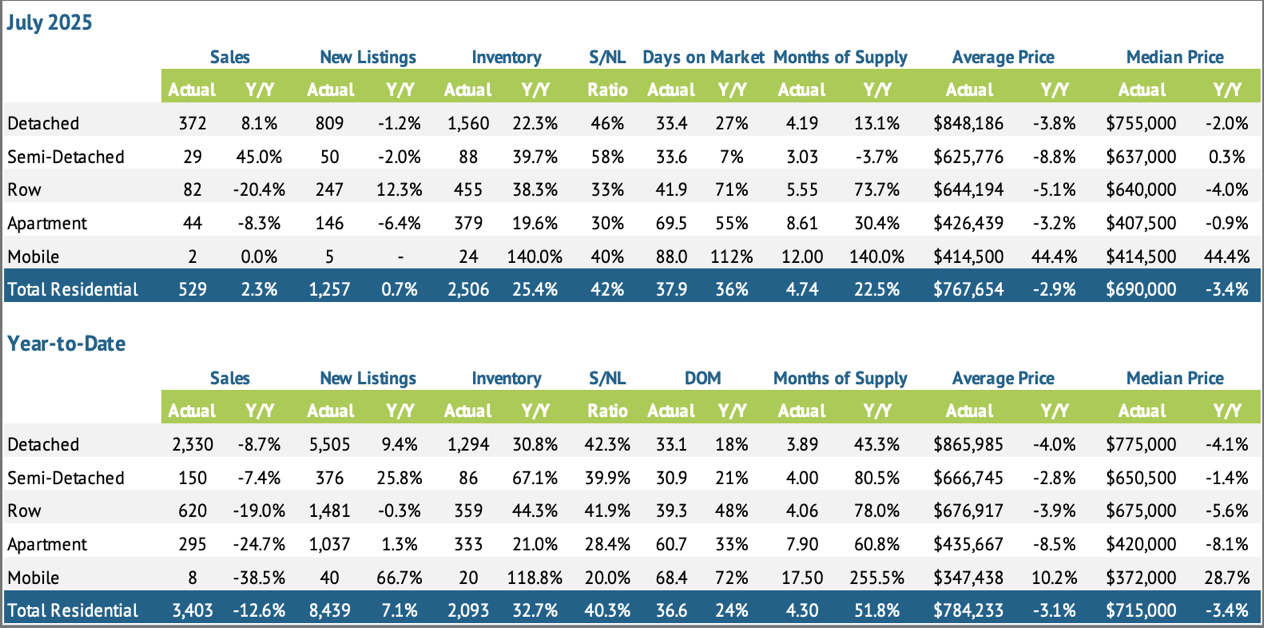
The Hamilton real estate market in July 2025 saw mixed performance across property types, with detached and semi-detached homes recording notable sales growth, while townhomes and apartments continued to see softer activity. Price trends remain varied, with benchmark values easing across all categories.
Detached Homes
- Sales: 372 (↑ 8.1% YoY)
- New Listings: 809 (↓ 1.2%)
- Inventory: 1,560 (↑ 22.3%)
- Average Price: $755,000 (↓ 2.0%)
- Benchmark Price: $782,400 (↓ 7.0%)
Semi-Detached Homes
- Sales: 29 (↑ 45.0%)
- New Listings: 50 (↓ 2.0%)
- Inventory: 88 (↑ 39.7%)
- Average Price: $625,776 (↓ 8.8%)
- Benchmark Price: $710,800 (↓ 4.0%)
Townhomes (Row Houses)
- Sales: 82 (↓ 20.4%)
- New Listings: 247 (↑ 12.3%)
- Inventory: 455 (↑ 38.3%)
- Average Price: $644,194 (↓ 5.1%)
- Benchmark Price: $615,000 (↓ 6.0%)
Apartments & Condos
- Sales: 44 (↓ 8.3%)
- New Listings: 146 (↓ 6.4%)
- Inventory: 379 (↑ 19.6%)
- Average Price: $426,439 (↓ 3.2%)
- Benchmark Price: $417,500 (↓ 11.0%)
Coming Up: Regional Summary
Next, we’ll focus on regional real estate activity within Hamilton, with a spotlight on Hamilton Mountain, the city’s most active area in July, and Dundas which has shown the smallest pullback in sales compared to long-term trends.
Regional Summary – July 2025
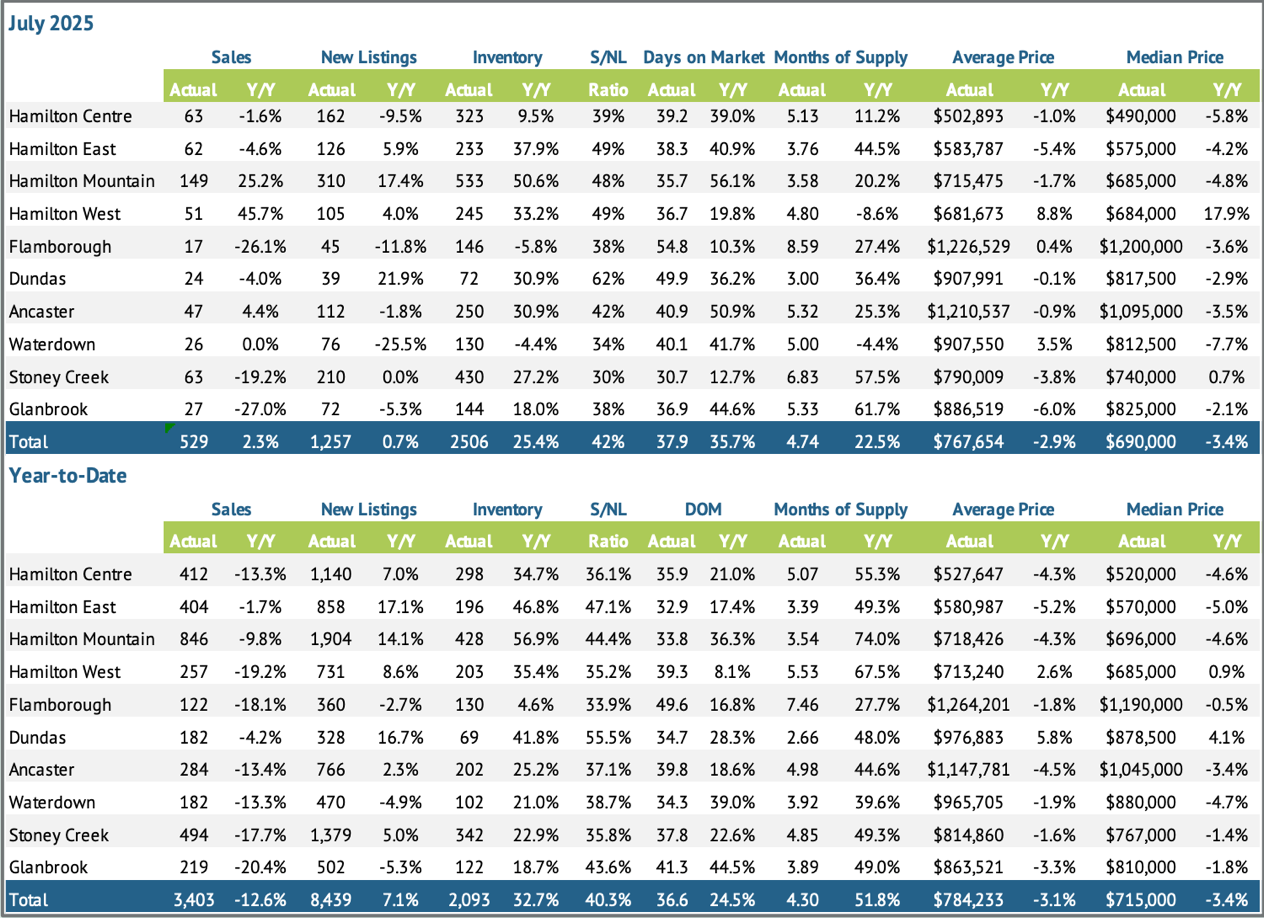
Inventory levels in Hamilton’s housing market remained elevated in July 2025, continuing to support more balanced and in some cases, buyer-favourable market conditions. Among the city’s regions, Hamilton Mountain led in both sales volume and new listings, while Dundas stood out for its resilience, posting one of the smallest pullbacks in sales compared to long-term trends.
While inventory growth was consistent across most areas, pricing trends varied. Hamilton Mountain saw modest year-over-year price declines, while Dundas maintained higher average prices despite a slight dip from last July. These differences highlight how neighbourhood-level dynamics can diverge from the broader city-wide picture, underscoring the value of localized market insight.
According to Cornerstone’s analysis, the combination of slower year-to-date sales and sustained listing activity has kept months of supply above historical norms. This is giving buyers more negotiating leverage, particularly in areas where price adjustments have been more pronounced.
Key Metrics by Area – July 2025
Hamilton Mountain:
- Sales: 149 (↑ 25.2% YoY)
- New Listings: 310 (↑ 17.4%)
- Inventory: 533 (↑ 50.6%)
- Months of Supply: 3.58
- Average Price: $715,475 (↓ 1.7% YoY)
Dundas:
- Sales: 24 (↓ 4% YoY)
- New Listings: 39 (↑ 21.9%)
- Inventory: 72 (↑ 30.9%)
- Months of Supply: 3.00
- Average Price: $907,991 (↓ 0.1% YoY)
Coming Up: Average Residential Prices by District
While regional stats provide valuable insight into overall sales, inventory, and price trends, zooming in on sub-area price breakdowns offers a closer look at how local real estate values are shifting. In the next section, we’ll continue our focus on Hamilton Mountain and Dundas, examining the average residential sale prices by sub-area, highlighting how each area has evolved over the past year.
Average Residential Prices by District – July 2025

This section provides a closer look at average residential sale prices across Hamilton’s sub-areas, offering a hyperlocal perspective on how property values shifted year-over-year. For July 2025, our focus is on Hamilton Mountain and Dundas, two areas that stood out in this month’s market activity.
Below, we’ve highlighted the average sale prices by sub-area, alongside the year-over-year percentage changes. This data helps buyers and sellers better understand neighbourhood-specific trends and make informed decisions.
Hamilton Mountain Sub-Area Breakdown
Hamilton Mountain comprises areas 15, 16, 17, 18, 25, and 26, and continues to lead the city in overall sales volume. July’s data shows a mix of gains and declines, reflecting varying buyer demand across neighbourhoods.
- Area 15 – $727,163 (↓ 9%)
- Area 16 – $773,362 (↑ 9%)
- Area 17 – $582,575 (↓ 8%)
- Area 18 – $669,189 (↑ 24%)
- Area 25 – $796,714 (0%)
- Area 26 – $661,454 (↓ 9%)
The standout this month was Area 18, with a strong 24% year-over-year increase, while Areas 15, 17, and 26 saw price declines. This contrast highlights the importance of understanding micro-market trends when buying or selling on the Mountain.
Dundas Sub-Area Breakdown
Dundas, made up exclusively of Area 41, experienced no year-over-year change in average sale price.
This stability underscores Dundas’s reputation as a sought-after market with limited inventory, where demand remains consistent even amid broader market shifts.
What This Means for Buyers and Sellers
Hamilton’s sub-area trends reinforce that market conditions can differ significantly even within the same city. On the Mountain, some neighbourhoods are heating up while others are softening, creating opportunities for strategic buying and selling. Dundas remains a stable, desirable option for those seeking long-term value.
Hamilton Real Estate Outlook: Expert Insights & Summer Trends
Next, we’ll shift to expert commentary from Nicolas von Bredow, spokesperson for the Hamilton-Burlington region at the Cornerstone Association of REALTORS®. He’ll provide perspective on the latest sales, price, and inventory trends, and what these shifts could mean for buyers and sellers moving deeper into the summer market.
Summary & Expert Insights – Hamilton Real Estate Market
In July 2025, the Hamilton-Burlington real estate market recorded 886 home sales, up 5.5 per cent year-over-year and marking the first annual increase since late 2024. While activity improved over last month, year-to-date sales remain 16 per cent lower than in 2024 and well below the 10-year average.
New listings eased to 1,257 units, raising the sales-to-new-listings ratio to 46 per cent and keeping months of supply at 4.4, still above pre-pandemic levels and favouring buyers. The unadjusted benchmark price fell to $763,700, over nine per cent lower than last July, with the sharpest declines in apartment-style homes.
“July’s sales increase is a hopeful sign of recovery,” says Nicolas von Bredow, spokesperson for the Cornerstone Association of REALTORS®. “Lower home prices are bringing more buyers back into the market.”
What This Means for You
With sales showing early signs of improvement and inventory levels still elevated, buyers may find an ideal mix of choice and negotiation power as summer continues. Meanwhile, sellers should remain mindful of pricing strategies, as competition from increased supply can quickly impact buyer interest.
Thinking about buying or selling in the Hamilton and surrounding area? The experienced sales representatives at Judy Marsales Real Estate Brokerage are here to help you navigate changing market conditions with confidence.
Ready to Buy or Sell in Hamilton? We’re Here to Help
Whether you’re searching for your dream home, planning your next move, or exploring investment opportunities, Judy Marsales Real Estate Brokerage is your trusted partner in Hamilton real estate.
With 37 years of experience in the local market, we provide the insight, personalized guidance, and strategic expertise you need to navigate today’s evolving real estate landscape, especially as elevated inventory and shifting buyer demand shape market conditions.
Why Work With Us?
- Tailored Support: Whether you're a first-time buyer or a seasoned investor, our sales representatives are here to guide you every step of the way.
- Deep Market Knowledge: Our team understands Hamilton’s neighbourhood trends, pricing dynamics, and inventory shifts giving you a clear advantage.
- Real-Time Listings & Data: Access up-to-date market stats and the latest listings in Hamilton, Ancaster, Dundas, and beyond.
Stay Connected With Us
Follow us on Facebook and Instagram for:
- Monthly Market Updates: Including July 2025’s sales performance, price trends, and inventory data.
- New Listings: Be the first to see beautiful homes as they hit the market.
- Local Stories: Discover the people and communities that make Hamilton unique.
Get in Touch With Our Sales Representatives
Have questions or are you ready to get started? Contact one of our three office locations:
Explore More Real Estate Tools
- Home Value Calculator: Curious about your home’s current value? Try our free online tool for a quick estimate.
- Cornerstone’s July 2025 Market Report: Dive deeper into this month’s real estate stats, including property prices, neighbourhood trends, and expert market insights.
Make your next move with confidence by partnering with Judy Marsales Real Estate Brokerage — trusted experts in Hamilton real estate, with the local knowledge and experience to help you succeed in today’s market.