
Hamilton & Burlington Real Estate Market Update – January 2026
The Cornerstone Association of REALTORS® (Cornerstone) has released its January 2026 real estate statistics, showing a market where sales remain softer year-over-year, inventory is higher, and homes are taking longer to sell across the region. In total, 779 home sales were recorded through Cornerstone’s MLS® System in January, down 7.0% month-over-month and 21.9% year-over-year.
New listing activity also returned seasonally after December, with 2,173 new listings added in January (up sharply month-over-month, which is typical for this time of year). Inventory continued to rise, bringing the region to 3 months of supply by month-end—while average days on market reached 54 days, the highest level reported in over a decade.
“As homes stay on the market longer and interest rates stabilize, opportunities for buyers continue to improve,” says Bill Duce, CEO of Cornerstone.
This Hamilton & Burlington real estate market update for January 2026 will highlight:
- Regional trends in sales, new listings, and inventory
- What months of supply and days on market reveal about today’s pace and leverage
- What current conditions mean for buyers and sellers as we move through early 2026
Coming Up: Key Highlights From January’s Market Performance
Next, we’ll break down the combined Hamilton + Burlington regional totals, then move into a Hamilton-only market focus to highlight local trends, property types, and what they mean for your next move.
Hamilton & Burlington Combined Market Snapshot – January 2026
The Hamilton-Burlington market entered 2026 with a steadier month-to-month pattern, even as results remained softer than last year. Sales edged up slightly from December, while new listing activity rebounded sharply in a typical seasonal lift—giving buyers more choice and more time to evaluate options. Inventory levels also continued to trend higher year-over-year, keeping overall conditions closer to balanced and improving negotiating flexibility in many segments.
“The Hamilton-Burlington market is showing signs of stability with a slight month-over-month increase in sales despite the year-over-year decline. With homes staying on the market longer and inventory up by over 23% compared to last year, buyers have more options and potentially more negotiating power. The unchanged monthly HPI indicates we may be reaching a pricing plateau after the significant year-over-year adjustments we've seen.” — Bill Duce, Cornerstone CEO
Hamilton-Burlington Area Highlights
- Sales: 470 (↑ 1.5% month-over-month)
- New listings: 1,203 (↑ 119.9% month-over-month)
- Inventory: ↑ 23.1% year-over-year | Months of supply: 3.2
- MLS® HPI: unchanged month-over-month | ↓ 10.0% year-over-year
- Average days on market: 57 days
Average Price Snapshot (reported by area)
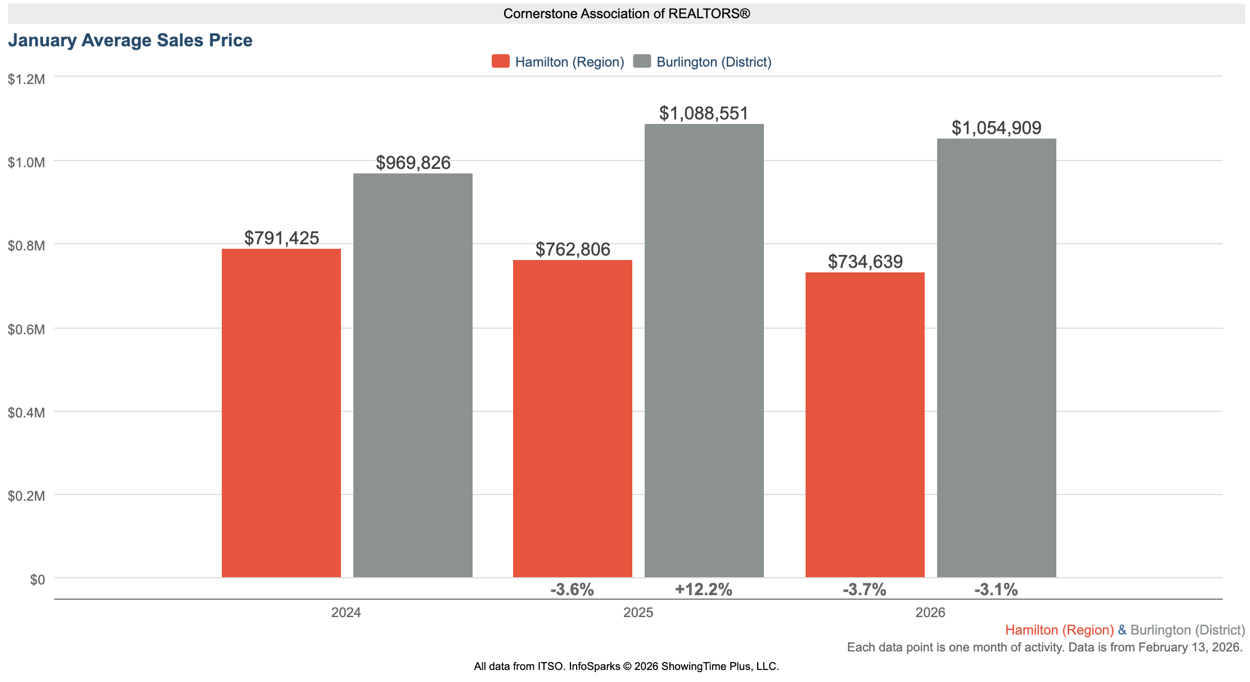
- Hamilton average price: $734,639 (↓ 3.7% year-over-year)
- Burlington average price: $1,054,909 (↓ 3.1% year-over-year)
What this suggests right now: With inventory up year-over-year and days on market elevated, buyers are generally seeing more breathing room. For sellers, results are still very achievable—especially when pricing is aligned with current conditions and presentation is strong—because the market is rewarding homes that show well and are positioned accurately from day one.
Coming Up: Hamilton Market Focus – January 2026
Next, we’ll move from the regional overview into a Hamilton-only breakdown, including sales, listings, inventory, and pricing—followed by a closer look at performance by property type and key district trends.
Hamilton Residential Real Estate: Price, Sales & Market Conditions
January opened with a quieter year-over-year pace in Hamilton, alongside a more measured national backdrop. The Canadian Real Estate Association (CREA) reported that Canadian home sales declined 2.7% month-over-month in January and were down 4.5% year-over-year, while inventory across Canadian MLS® Systems remained higher than last year—supporting conditions where many buyers have more choice and more time heading toward spring.
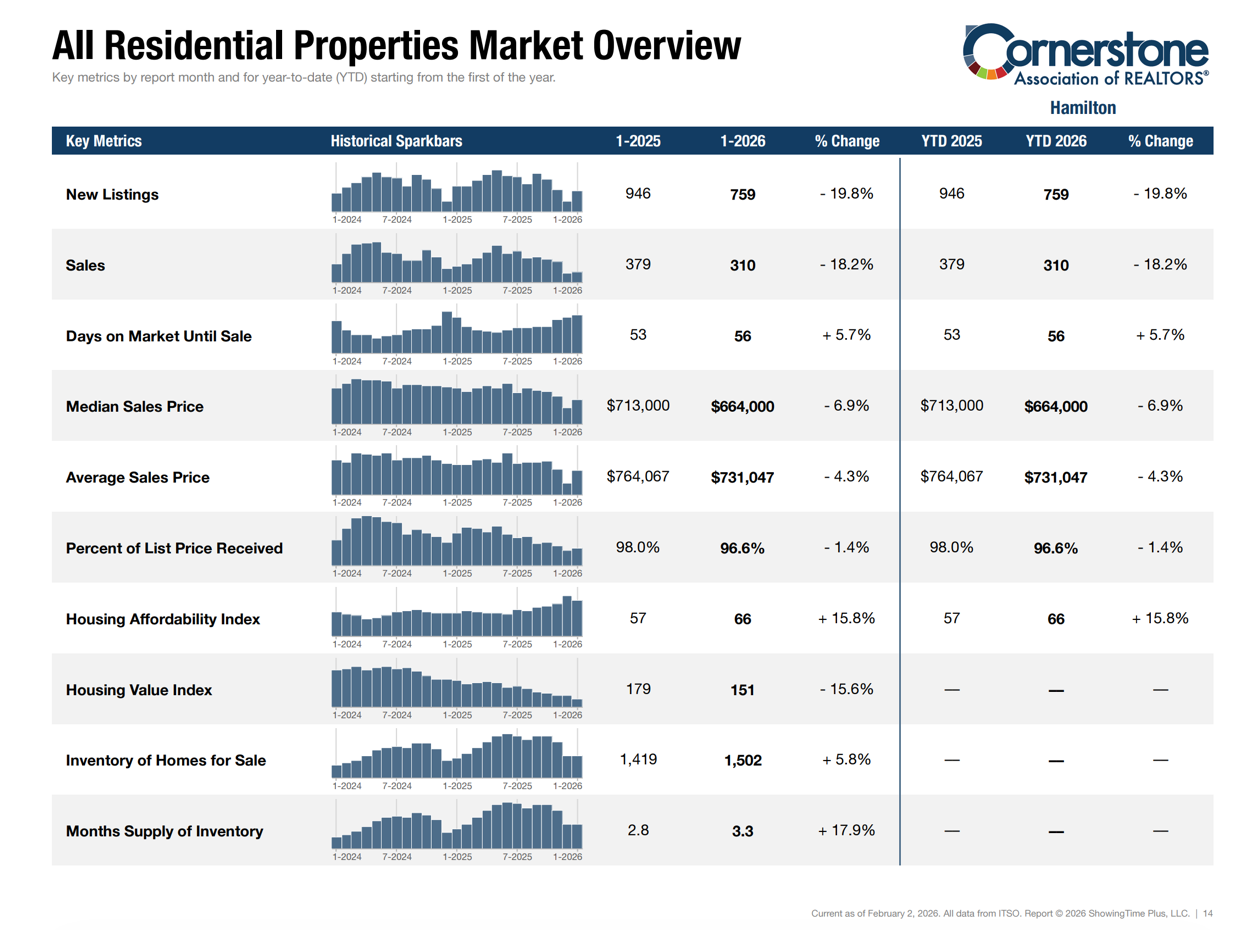
In Hamilton, Cornerstone’s all-residential snapshot shows softer activity and higher supply compared to last January. Hamilton recorded 310 residential sales (↓ 18.2% year-over-year) and 759 new listings (↓ 19.8%). Inventory rose to 1,502 active listings (↑ 5.8%), bringing months of supply to 3.3 (↑ 17.9%). Average days on market increased to 56 days (↑ 5.7%).
Pricing also softened year-over-year:
- Average sale price: $731,047 (↓ 4.3% YoY)
- Median sale price: $664,000 (↓ 6.9% YoY)
- Percent of list price received: 96.6% (down from 98.0%)
What this suggests right now: Hamilton is moving at a more balanced pace than last year, with buyers generally benefiting from more selection and less urgency. For sellers, accurate pricing and strong presentation remain essential, especially as days on market trend higher.
Coming Up: A Closer Look by Housing Segment (Hamilton)
Next, we’ll break down Hamilton’s results by Single Family and Townhouse/Condo segments. This format helps clarify where inventory is building faster, where timelines are lengthening, and how pricing and negotiating conditions can differ depending on the type of home.
Hamilton Market Breakdown by Housing Segment
To get a clearer picture of what’s driving conditions in Hamilton, it helps to separate the market by housing segment. Single family homes and townhouse/condo properties are responding differently to today’s pricing and supply environment—so below, we’ve summarized the key January indicators for each segment and what they may mean for buyers and sellers.
Single Family Homes (Hamilton)
Single family activity slowed from last January, while supply remained relatively steady.
Key single family indicators (January):
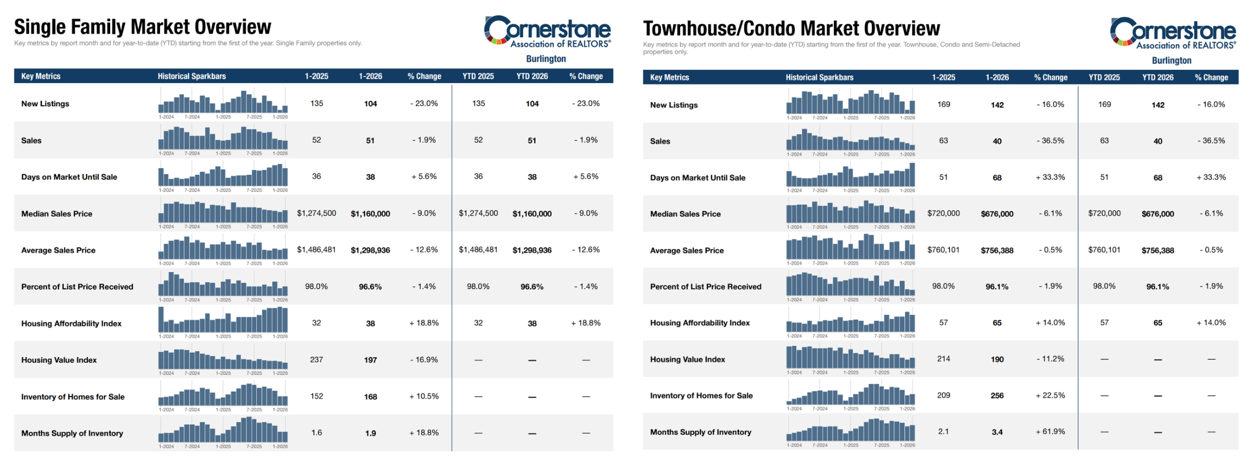
- New listings: 458 (↓ 25.4% YoY)
- Sales: 201 (↓ 18.6% YoY)
- Inventory: 889 (↑ 1.8% YoY)
- Months of supply: 2.8 (↑ 7.7%)
- Days on market: 56 (↑ 5.7%)
- Median price: $705,000 (↓ 10.2%)
- Average price: $808,888 (↓ 4.3%)
- Percent of list price received: 96.4% (↓ 1.8%)
Takeaway: This segment is closer to balanced conditions, but price sensitivity is higher than last year. Homes that are well-positioned and well-presented can still move efficiently, while overpricing can cost time and momentum.
Townhouse/Condo Homes (Hamilton)
The townhouse/condo segment leaned more buyer-friendly in January, with inventory and months of supply rising more sharply.
Key townhouse/condo indicators (January):
- New listings: 301 (↓ 9.3% YoY)
- Sales: 109 (↓ 17.4% YoY)
- Inventory: 613 (↑ 12.3% YoY)
- Months of supply: 4.4 (↑ 41.9%)
- Days on market: 58 (↑ 7.4%)
- Median price: $597,000 (↓ 4.9%)
- Average price: $587,504 (↓ 3.9%)
- Percent of list price received: 96.9% (↓ 0.7%)
Takeaway: With more supply and longer selling timelines, buyers often have more negotiating flexibility in this segment. For sellers, strategy matters—pricing accurately, preparing the home well, and marketing strongly to stand out.
Coming Up: Area-by-Area Breakdown Across Hamilton
Next, we’ll move into an area-by-area breakdown across Hamilton’s key market districts to show where sales activity held firmer, where inventory is building fastest, and how pricing is trending across different parts of the city. This neighbourhood-level view is important because Hamilton doesn’t move as one uniform market—conditions can shift meaningfully from one area to the next depending on housing type, pricing, and buyer demand.
Hamilton District Snapshot: Prices & Sales by Area (January 2026)
To round out Hamilton’s January picture, here’s a district-level snapshot showing how average sale price and sales activity varied across key market areas.
Two standouts this month:
- Hamilton Mountain led the city in sales with 79 transactions, while the average sale price was $696,860 (↓ 3.9% YoY).
- Flamborough posted the highest average sale price at $1,304,375 (↑ 20.3% YoY), with 8 sales—a smaller sample that can contribute to bigger year-over-year swings.
District-level results (January 2026):
- Ancaster Avg: $1,034,500 (↓ 0.8% YoY) | Sales: 33 (0.0% YoY)
- Dundas Avg: $1,207,143 (↑ 35.0% YoY) | Sales: 7 (↓ 58.8% YoY)
- Flamborough Avg: $1,304,375 (↑ 20.3% YoY) | Sales: 8 (↓ 38.5% YoY)
- Glanbrook Avg: $729,882 (↓ 5.3% YoY) | Sales: 17 (↓ 37.0% YoY)
- Hamilton Centre Avg: $506,692 (↓ 6.1% YoY) | Sales: 50 (↑ 8.7% YoY)
- Hamilton East Avg: $563,049 (↑ 3.6% YoY) | Sales: 41 (↑ 5.1% YoY)
- Hamilton Mountain Avg: $696,860 (↓ 3.9% YoY) | Sales: 79 (↓ 13.2% YoY)
- Waterdown Avg: $966,111 (↓ 1.9% YoY) | Sales: 18 (↓ 10.0% YoY)
- Stoney Creek Avg: $802,981 (↓ 1.9% YoY) | Sales: 44 (↓ 36.2% YoY)
- Hamilton West Avg: $585,234 (↓ 14.9% YoY) | Sales: 23 (↓ 8.0% YoY)
What this suggests right now: Pricing and pace are still highly neighbourhood-specific. If you’re making a move in 2026, district-level context matters as much as the city-wide averages.
Coming Up: Market Summary & What It Means for You
Next, we’ll translate January’s numbers into practical takeaways for buyers, sellers, and investors—what they suggest about leverage, pricing, and timing—then share how to connect with Judy Marsales Real Estate Brokerage for neighbourhood-level guidance..
Summary & Expert Insights: Hamilton & Burlington Real Estate Market (January 2026)
January opened with a measured pace across the Hamilton-Burlington market area, with softer year-over-year sales alongside a seasonal rebound in new listings. Cornerstone reported 779 total home sales across its MLS® System (↓ 21.9% YoY) and 2,173 new listings, while inventory remained elevated, keeping conditions more choice-driven for buyers. Days on market reached 54, reinforcing a slower, more balanced pace than last year.
In the Hamilton-Burlington market area, activity was steady month-over-month with 470 sales (↑ 1.5% MoM) and 1,203 new listings (↑ 119.9% MoM). Months of supply was 3.2, and the MLS® HPI was unchanged month-over-month (↓ 10.0% YoY), suggesting pricing may be stabilizing after the larger adjustments of the past year.
Within Hamilton, the market recorded 310 sales (↓ 18.2% YoY) and 759 new listings (↓ 19.8% YoY), with 1,502 active listings and 3.3 months of supply. The average sale price was $731,047 and the median sale price was $664,000. Segment trends also remained split: single family conditions were closer to balanced (2.8 months of supply) while townhouse/condo leaned more buyer-friendly (4.4 months).
“As homes stay on the market longer and interest rates stabilize, opportunities for buyers continue to improve,” says Bill Duce, CEO of Cornerstone.
What This Means for You
- Buyers: More inventory and longer selling timelines mean more opportunity to compare options, negotiate, and include the right protections—especially in higher-supply segments.
- Sellers: Success is still very achievable, but strategy matters. Accurate pricing, strong presentation, and confident marketing are key as buyers become more selective.
- Investors: Higher supply and softer pricing in select segments may create opportunities where negotiation leverage is stronger.
Ready to Buy or Sell? Work With Judy Marsales Real Estate Brokerage
Whether you're planning a purchase, preparing to list, or considering an investment, Judy Marsales Real Estate Brokerage offers the local expertise and trusted guidance you need in today’s market. With 38 years of experience serving our community, our brokerage delivers personalized service and results-driven strategy across Hamilton, Dundas, Ancaster, Burlington, and beyond.
Why Work With Us
- Personalized Guidance for first-time buyers, move-up purchasers, downsizers, and long-time homeowners
- Neighbourhood Expertise grounded in district-by-district insight and current pricing trends
- Up-to-Date Market Knowledge so you can act confidently when the right opportunity appears
Stay Connected
Follow us on Facebook and Instagram for monthly market updates, new listings, open houses, and local community highlights.
Get in Touch
Locke Street South: locke@judymarsales.com | 905-529-3300
Westdale: westdale@judymarsales.com | 905-522-3300
Curious what your home could sell for in today’s market? Use our Home Value Calculator for a quick estimate, or reach out for a more detailed, neighbourhood-specific evaluation. For broader context, you can also review Cornerstone’s January 2026 market statistics.
Make your next move with clarity and confidence — choose Judy Marsales Real Estate Brokerage for trusted local guidance.